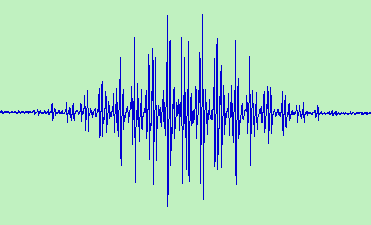

Because of its stability and ease of preparation, the triphenylmethyl radical played a significant role in the development of ESR spectroscopy. The ESR spectrum shown above was recorded in benzene solution at room temperature by Dr Angelo Alberti on a modern Bruker spectrometer.
Curiously the first reported spectrum was of a sample 53% enriched in 13C at the radical centre [1]. A spectrum showing resolved proton hyperfine structure was published shortly afterwards [2] but it was some time before a full analysis of the 196 line spectrum was achieved [3]. The 196 lines arise from a 1:3:3:1 quartet splitting of 2.86 G from the 3 para-protons, a 1:6:15:20:15:6:1 septet of 2.61 G from the 6 ortho-protons and a further 1.14 G septet from the six meta-protons. The 13C splitting in the methyl position is 26 G and the g-factor is 2.0026. The analysis was soon confirmed by computer simulation [4].
Triphenylmethyl also featured in some of the earliest ENDOR investigations of free radicals in solution [5]. The ENDOR spectrum has just six lines compared with the 196 lines of the ESR spectrum and the technique has been extensively used in studies of substituted triarylmethyl radicals where the esr spectra have extremely complex hyperfine patterns.
References
1. S.I. Weissman and J.C. Sowden, J. Amer Chem. Soc., 1953, 75, 520.
2. H.S. Jarrett and G.J. Sloan, J. Chem. Phys., 1954, 22, 1783.
3. D.B. Chestnut and G.J. Sloan, J. Chem. Phys., 1960, 33, 637.
4. P.B. Ayscough, A.P. McCann and R. Wilson, Proc. Chem. Soc., 1961, 16.
5. J.S. Hyde, J. Chem. Phys.,1965, 43, 1806; A.H. Maki, R.D. Allendoerfer, J.C. Danner, and R.T. Keys, J. Amer Chem. Soc., 1968, 90, 4225.
Back to main menu