5. Nanosecond ArF Pulsed Laser Ablation of Zinc Oxide and Pulsed Laser Deposition of Thin Zinc Oxide Films
5.1. Introduction
5.1.1. Applications of zinc oxide
Zinc oxide is a material with wide applications, ranging from its use as a pigment in paints and an additive in sunscreen to highly technological applications as a catalyst and in solid state devices. These applications all arise from the unique properties of the material.
Zinc oxide is a wide band gap semiconductor (band gap = 3.4 eV) which makes it an excellent visible transparent, UV absorbent material. This, together with its low toxicity, makes it an ideal material to use in sunscreens as a UV blocking element. The wide band gap also appeals to the semiconductor industry. The material can be readily modified to produce an n-type doped semiconductor. The most commonly used n-type dopants are aluminium and gallium.[1]-[3] Recent developments in the field also yielded p-type doped zinc oxide via doping with arsenic, [4] which is a step towards the production of p-n junctions of zinc oxide.[5] It is hoped that such p-n junctions will find use as laser diodes, with their lasing transition in the blue. Doping also increases the conductivity of the material. Since zinc oxide is intrinsically transparent to visible light this allows production of a conducting visible transparent material. Such materials are used as electrodes in solar cells and in phosphor screens. Thin films of zinc oxide also exert a capability for second harmonic generation [6] suggesting interesting photonic applications for the material. A very recent development is the use of zinc oxide as a lasing medium itself. This property has been illustrated in thin films [7],[8] and nanotubes [9] of zinc oxide.
5.1.2. Laser ablation of zinc oxide and deposition of thin films
In this chapter the two aspects of the process, namely the pulsed laser ablation of ZnO and the deposition of ZnO thin films will be studied in detail. Pulsed laser ablation in vacuum will be studied to obtain a detailed picture of the governing processes for this specific material and, where necessary, comparison with the ablation of other materials will be made, to support the interpretations of the behaviour. Ablation behaviour in a background gas will be studied also, since optimal film deposition is found to occur if a small background pressure of oxygen is used.
The investigation of the pulsed laser deposition will concentrate on the optimisation of the deposition parameters, i.e. substrate temperature and background pressure of oxygen. The deposited films are analysed by numerous techniques to obtain a detailed picture of the specifics of the film growth under the given conditions. The main properties of interest are; crystallinity and alignment (studied by XRD and TEM), UV-visible transparency and band gap (studied by UV-VIS spectrometry). Results on the properties of aluminium and gallium doped ZnO films will be reported also.
In addition, results of ab initio theoretical calculations of the bulk and surface structure of ZnO will be presented and discussed within the framework of presently accepted theories of oxide surfaces.
5.2. Experimental
The experimental set-up has been discussed in Chapter 2. Specific for the ZnO set-up is the necessity to grow films in small background pressures of oxygen and nitrogen gas and on a heated substrate (≤ 500 °C). To obtain a small background pressure of oxygen (5 mTorr - 0.5 Torr), pure oxygen was bled through a mass flow controller at a flow rate of 0.5 sccm.
The plasma properties were measured via OES and Langmuir Probe measurements. The first technique yields relative measures of the plasma excitation and absolute figures for the velocity of the emitting transient species. The latter technique monitors the transient behaviour of the electrons in the ablation plume. Combining results of the two techniques provides a consistent picture of the ablation behaviour of ZnO.
The target morphology changes during ablation. The unablated ZnO is yellowish white and insulating while the ablated area turns grey and conducting in accordance with reference [10]. More information about the target surface morphology after ablation will be provided in section 5.3.4. The experiments are all performed on a preablated track on the target to try to minimise any effects of this changing morphology.
5.3. Pulsed laser ablation of zinc oxide
The pulsed laser ablation of ZnO was studied in vacuum and in a small background pressure of oxygen via optical emission spectroscopy and Langmuir/Ion probe measurements. In the next paragraphs the ablation behaviour of zinc oxide in vacuum, then in small background pressures of O2 will be discussed.
5.3.1. Time integrated optical emission spectroscopy in vacuum
The time integrated, wavelength dispersed UV-visible optical emission of the plume accompanying 193 nm ablation of ZnO, originating from the ablation spot and viewed along the surface normal, was studied to deduce information about the plasma formation and the ablation behaviour. The plasma formation is dependent on the laser fluence, and the observed optical emission varies with distance from the target surface. Optical emission spectra obtained in this way are compared with a spectrum arising from ablation of pure zinc. Optical emission spectra observed at laser fluences of 4 J/cm2 and 20 J/ cm2, at a distance of 5 mm along the surface normal are given in Figure 5.1, together with a corresponding spectrum taken using a pure zinc target (20 J/cm2 and 5 mm).
Figure 5.1: (a) and (b) Emission spectra of ZnO (c) emission spectrum of Zn all measured at a distance of 5 mm from the target, (a) and (c) for a fluence of 10 J/cm2 and (b) for a fluence of 4 J/cm2. The observed lines are listed in Appendix 6 and a Grotrian diagram for Zn / Zn+ is given in Figure 5.6. SO indicates lines appear in second order.
The brightest emission lines are the 328.2, 330.3, 334.5 and 636.2 nm lines of atomic zinc, the 491.3 and 492.5 nm lines of the zinc cation and the 777.2 nm line of the oxygen atom.[11] Comparison between the zinc oxide and zinc spectra shows that most of the emission lines in the spectrum of zinc oxide can be attributed to zinc atomic and cationic emission. The observed lines attributable to oxygen are all associated with the neutral atom. Even at the highest laser fluence employed no optical emission attributable to oxygen cations is observed.
The emission arising from the ablation of Zn and ZnO
has also been compared via a correlation diagram. In this diagram the intensities of various features in the
emission spectrum from ablation of zinc are plotted against the corresponding
intensities in the emission from ablation of zinc oxide; this is shown in Figure 5.2. Points lying
on the x-axis indicate those lines that only appear in the emission from
ablation of zinc oxide. These points
can all be associated with points from line emission from atomic oxygen. The dense region close to the origin is related
to less intense emission lines and background noise. The points with higher (x,y)-values correspond to the more
intense emission lines. The ellipses
collect together points on the correlation graph associated with a particular
transition. The regions with a lower
gradient (closer to the x-axis) are related with optical emission that is more
prevalent in the ablation of zinc oxide than in zinc and vice versa. A straightforward conclusion to be drawn
from this correlation diagram is that the intensity of specific emission lines
arising from ablation is dependent on the composition of the plume, the
additional oxygen existing in the ablation plume of ZnO is also affecting the
relative intensity of the Zn and Zn+ lines. More quantitatively, it can be seen that the
636.2 nm line of atomic Zn is relatively more intense in the ablation of ZnO
than Zn, while the 776.0 and 761.4 mn lines of Zn+
appear with greater relative intensity in the ablation of Zn than ZnO.
Figure 5.2: Correlation diagram between the emission line intensities in the spectrum from Zn and ZnO targets at the distance of 5 mm from the target, along the surface normal and a fluence of 10 J/cm2. The ellipses indicate the emission lines associated with the points on the correlation graph.
Comparison between spectra obtained using the ZnO target at two different laser fluences reveals that the total optical emission increases with laser fluence, but that the relative emission intensities of different emission lines is dependent on the fluence. For example, the relative emission intensities of zinc atom and cation lines are highly dependent on the laser fluence used.
Further illustration of the fluence dependence of the relative intensities of different emission lines is given in Figure 5.3. The relative intensity of the emission lines is normalised and averaged over a few lines as indicated in the caption. From this figure it can be concluded that the relative optical emission intensity is species dependent. Different emission lines of atomic zinc show a linear dependence on the incident fluence, whereas the emission arising from transitions within a Zn+ varies non-linearly on the fluence. Emission arising from transitions within the oxygen atom shows a linear dependence on the incident laser fluence, although the error bars are larger (compared with the zinc lines). This could be explained by the poor transmission efficiency of the spectrometer and the low quantum efficiency of the detector at the long wavelengths at which the oxygen lines appear.
The distance dependence of the optical emission was studied also, and a summary of the results is given in Figure 5.4. The time integrated optical emission shows typical decay behaviour with increasing distance at a fluence of 20 J/cm2. The dependence of the optical emission on distance is again species dependent. Zinc ion lines decay much faster than zinc and oxygen atom lines. The intensity versus distance plot for oxygen atom emission lines is comparable to that of the zinc atom emission lines.
Figure 5.3: Fluence dependence of the optical emission for (a) Zn atom, (b) oxygen atoms and (c) Zn+ ions arising in the 193 nm laser ablation of a ZnO target. The lines considered for obtaining the plot are the 468.0, 472.2, 481.0 and 636.2 nm lines for Zn, the 777.2, 844.6 and 926.1 nm lines for O and the 491.1 and 492.4 nm lines for Zn+. The maximum absolute intensity of each optical emission line was normalised to one. The fitted curves serve to indicate the trends; the curves for (a) and (b) are straight lines, while the fitting curve for (c) is a third order polynomial; this order polynomial provided the best fit to the data.
Figure 5.4: Distance dependence of the emission lines at a fluence of 20 J/cm2. The selected emission lines for the plot are the 481.1 nm line for Zn, the 844.6 nm line for O and the 492.4 nm line for Zn+. The absolute intensity values for each of the emission lines are normalised to one at d = 3 mm. Other optical emission lines for the same species give the same distance dependence.
The optical emission lines observed at short distances (Figure 5.5) appear broadened. This we attribute to an intrinsic pressure broadening, due to the high charge density in the region just in front of the target. In addition, the lines are seen to be superimposed on a continuous background emission. This background emission can be attributed to either Bremsstrahlung of the electrons heated by the laser interaction or Black Body radiation from large particles emitted by the target.
Figure 5.5: Emission within the wavelength region of 350-950 nm at 1 mm from the target for a fluence of 20 J/cm2. Important to note is that this spectrum is not corrected for the wavelength dependent transmission of the grating and the quantum efficiency of the CCD array. The transmission is at least 5 times higher ~500 nm than at the long wavelength limit (900 nm).
The time integrated optical emission spectrum is dominated by emission features from the zinc atom, the zinc ion and the oxygen atom. No oxygen ion emission lines are observed. The emission is correlated, as in the case of the 193 nm graphite ablation, with third body recombination within the plume. The ions in the plume recombine with electrons to form preferentially highly excited products, i.e. highly excited Rydberg states. These highly excited Rydberg states radiatively cascade down to the ground state. The cascade down mechanism does not involve a preferential route so, in the emission spectrum, all of the more intense emission lines expected from these products are observed. The observed transitions of the zinc atom and ion are given in Figure 5.6 as Grotrian diagrams.
Figure 5.6: Simplified Grotrian diagrams for Zn and Zn+, energies are given in eV. Transitions observed in emission are indicated by the arrows.
The proposal that three body recombination is the route for the observed emissions implies the existence of the reactant cation, thus observed Zn atom emission implies the existence of Zn+ cations in the plume (observed), and that Zn2+ ions are the source of the observed Zn+ emission. The non-observation of oxygen cationic lines in the emission spectrum implies that the plume is not hot enough to support oxygen dications. In addition, the emission line list provided in reference 11 indicates that there are strong emissions arising from the O+ cation in the observed wavelength region, supporting this statement. Comparing the ionisation potentials of the different observed species (9.39 eV for the zinc atom, 13.62 eV for the oxygen atom and 27.36 eV for the zinc cation) with the ionisation potential of the oxygen cation (48.74 eV) further supports this postulate.
Comparing the relative intensities of the emissions we see that the zinc cation lines have onsets at higher fluence and thereafter a steeper fluence dependence than the zinc atom lines. This is correlated with the creation mechanism of these ions. The observed optical emission is largely the result of the interaction of the laser photons with the ejected particles. This interaction can be divided into two processes, namely inverse Bremsstrahlung and multi-photon ionisation. The latter is generally considered to be more important in the case of UV laser ablation although, as has been shown in Chapter 4, MPI can trigger the inverse Bremsstrahlung mechanism (which is non-linearly dependent on the electron and ion concentration) by creating localised high concentrations of electrons and ions in the plume. The Zn ® Zn+ conversion can occur via a two-photon mechanism. Three 193 nm photons are necessary to create an oxygen cation from a ground state O atom, which is a much less likely multi-photon absorption process. A more plausible explanation is that the O+ cations are created via laser- plume interactions induced by inverse Bremsstrahlung. The interaction will heat up the plume, and O+ ions can be created either by charge transfer via a high-energy collision between a zinc ion and an oxygen atom or via electron-neutral inverse Bremsstrahlung. Zn+ emission attributable to e + Zn2+ recombinations, has a clear fluence threshold, which strongly indicates that these species are a secondary product of the ablation event arising from inverse Bremsstrahlung induced by the laser-plume interactions.
No plasma temperatures are calculated from the relative zinc atom to zinc cation emission since the intense zinc atom emission lines will be affected by self absorption, giving incorrect measures of their relative intensity and thus of the plasma temperature.
5.3.2. Time differentiated optical emission spectroscopy in vacuum
To gain information on the velocity of the emitting species the optical emission was also studied in time differentiated mode. The wavelength of an emission line is selected by a grating and the TOF transient is recorded by a PMT, the procedure gives species selective velocity information, as described in section 2.4.1. The emission lines selected for this study are 481.1 nm for the zinc atom, 776.9 nm for the oxygen atom and 491.4 nm for the zinc cation; TOF transients recorded for the different species are given in Figure 5.7 for three different distances.
Figure 5.7: TOF spectra of emissions monitored at 3, 6 and 9 mm from the target for (a) zinc atom (481.1 nm), (b) oxygen atom (776.9 nm) and (c) zinc cation (491.4 nm) lines. Note that the horizontal scale in (c) is five times smaller than in (a) and (b). All emission intensities are normalised to the same peak value.
The TOF transients illustrate that the velocity of the emitting zinc cations is higher than that of the emitting zinc and oxygen atoms. It is important to note that, the zinc cation emission will provide a measure of the Zn2+ velocity distribution and that the neutral emissions reflect the motion of the respective cations, given the assumption that these emissive states are generated by third body recombination. In the further discussion we will assume that third body recombination is the general creation mechanism for these excited and radiatively decaying states (Zn+ for neutral zinc atom emission, etc.). The TOF spectrum of the emitting zinc atoms (i.e. a probe of the nascent Zn+ distribution) shows double peak behaviour, the early time part of which correlates with the observed O emissions (and thus the nascent O+ ions). The slow tail in the TOF spectrum is clearly evident at short distances (close to the target) but merges with the high velocity peak at later time scales. The double peak behaviour is most noticeable for the intense zinc atom lines (Figure 5.8), indicating that this is a universal ablation behaviour correlated with all of the Zn emission lines. Interestingly, the zinc atom emission line with the least intense tail is the 636.4 nm line. This line also has the least intensity when recorded with the PMT and shows the lowest gradient on the Zn-ZnO correlation diagram (Figure 5.2).
Figure 5.8: The TOF profiles of different Zn emission lines from ZnO ablation at 20 J/cm2, measured 5 mm from the target surface. The 330.4, 334.5, 472.3 and 481.2 nm emission lines (a) show a bimodal distribution with a well distinguished slow tail, while the 636.4 nm emission line (b) shows a less pronounced bimodal distribution.
Further insight into the origin of the slow tail in the TOF spectrum of the Zn emission can be obtained by comparison with the TOF profile obtained for the oxygen emission, Figure 5.9. The slow tail observed for the TOF profile of the zinc emission lines is not noticeable in the TOF transient of the oxygen atom emission line. The TOF profile of the oxygen emission line appears to correlate with the fast part of the zinc emission TOF transient. This suggests that the ZnO ablation plume consists in fact of two separate distributions. The fast zinc distribution and oxygen distribution propagate at the same Centre of Mass (COM) velocity, which follows from hydrodynamic equilibration within the ZnO ablation plume, and a slower distribution is evident only in the zinc TOF profile. Secondly, this figure shows that the tail of the TOF profile of the zinc emission is less prevalent at later time scales and thus larger distances. This double peak could arise from photodissociation of molecular zinc fragments, e.g. Zn2, though we consider this formation mechanism unlikely given of the high photon energy. Note that, for example no C2 molecules were observed in 193 nm the ablation of graphite. With this in mind, it is likely that ejection from the surface results in far more monatomic species than clusters; the photodissociaton mechanism will thus be discarded in the following discussion. A more probable explanation for this behaviour will be presented later in this section.
Figure 5.9: Comparison between the TOF of the 481.2 nm emission line of the zinc atom and the TOF of the 776.9 nm emission line of the oxygen atom at (a) 5 mm, (b) 9 mm and (c) 15 mm.
The velocity can be deconvoluted from these TOF transients
by plotting the mean of the TOF signal versus the distance from the target
surface at which the transient is recorded.
Such plots are given in Figure
5.10, for the different recorded species. The zinc ion and the oxygen atom emission
lines follow a linear distance versus time relationship, the gradients of which
are correlated with the velocities of these species. The neutral zinc emission line has a more complicated distance
versus time dependence, as expected from the observation of the double peak
behaviour of the transient. The
intercept with the y- axis is governed by the experimental error, since the
viewing column is ~2 mm in diameter; this error can be assumed to equate to ~ ± 1
mm. The y-axis intercept of the fitted
line to the points associated with the oxygen emission falls within this error
bar (< 1 mm), but that for the line fitted to the points related with the Zn+
emission cuts the y-axis at –3.5 mm, outside the acceptable error range. This large value for the intercept has been
found in three separate experiments. A
possible explanation for this behaviour is that the Zn+ cations are,
during the onset of ablation, subjected to an initial acceleration, after which
they propagate with a constant velocity.
The offset is not important to the determination of a mean terminal
velocity, since this is calculated from the gradient of the distance versus
time plot.
The mean velocity of the emitting O atoms, for four different fluences, are given in Table 5.1, together with the calculated mean velocity of the emitting Zn+ ions at 20 J/cm2. Thus the mean velocity for the nascent O+ and Zn2+ ions and the fast peak of the Zn+ distributions (monitored via O, Zn+ and Zn emissions, respectively) does not seem to depend greatly on the applied laser fluence. The kinetic energy corresponding to the O+ velocity distribution (monitored via O* emission) is ~12 eV, for the fast peak of Zn+ distribution it is ~50 eV, while for the Zn2+ ions (monitored via Zn+*) it is ~305 eV. As Figure 5.10 shows, the zinc distribution appears to accelerate if one plots the local velocity (i.e. d/t) versus time.
Figure 5.10: Mean distance versus time plot for different species at 20 J/cm2. The lines through the plots for the emitting oxygen atoms and the zinc ions are least squares linear fits to the data points.
|
Monitored Species |
Fluence |
Velocity (km/s) |
Error (km/s) |
|
O* |
5 J/cm2 |
11.5 |
0.1 |
|
|
10 J/cm2 |
12.5 |
0.3 |
|
|
15 J/cm2 |
12.9 |
0.1 |
|
|
20 J/cm2 |
12.8 |
0.1 |
|
Zn+* |
20 J/cm2 |
28.5 |
0.1 |
Table 5.1: Mean velocities calculated for four different fluences for the monitored O* species and for 20 J/cm2 for the Zn+* species. The reported error bar is the standard deviation of the calculated velocity observed for three separate sets of data.
A second way to analyse the data is to perform a Jacobian transformation and convert the TOF spectrum into velocity space. This procedure has been done for the emitting zinc atom, zinc ion and oxygen atom distribution and the resulting velocity distributions are given in Figure 5.11.
Figure 5.11: TOF-velocity conversion for nascent (a) Zn*, (b) O* and (c) Zn+* distributions from ZnO ablation at 20 J/cm2. The transients for the emitting oxygen neutral and zinc cation distributions have been normalised to each other, while the transients for the emitting zinc neutral distribution are given unnormalised.
In velocity space the velocity distributions of the emitting Zn+* ions, the O*, and the faster part of the distribution of Zn* species are each independent of the distance at which the transient has been taken. This accords with the observation made for the TOF transients that the species propagate with a constant velocity. The velocity spread is also independent of the distance, giving a picture of a plume propagating with a constant COM velocity and velocity dispersion. From the converted TOF transients one can calculate a mean velocity and a velocity spread. This is given in Table 5.2 for the emitting oxygen atoms and the zinc ions.
|
Monitored Species |
Fluence
|
Velocity (km/s) |
FWHM (km/s) |
|
O* |
5 J/cm2 |
11.9 ± 0.1 |
9.8 ± 0.2 |
|
|
10 J/cm2 |
12.2 ± 0.7 |
9.9 ± 0.4 |
|
|
15 J/cm2 |
12.8 ± 0.1 |
9.9 ± 0.2 |
|
|
20 J/cm2 |
12.7 ± 0.2 |
9.8 ± 0.2 |
|
Zn+* |
20 J/cm2 |
31.0 ± 0.1 |
9.2 ± 0.3 |
Table 5.2: Velocity and velocity spread of the emitting oxygen atoms and zinc ions as shown in Figure 5.11. The figures are obtained by fitting a split gaussian to the experimental distribution. For the emitting Zn+* ion distribution the slow tail was discarded in the process.
As can be concluded from Table 5.2 the oxygen cations (monitored via the O* emission) propagate with a centre of mass velocity of ~12 km/s and a FWHM of ~10 km/s for all the fluences investigated. The zinc dication distribution propagates with a velocity of ~30 km/s with a FWHM of ~9 km/s. The ratio of the centre of mass velocity and the FWHM velocity spread is substantially smaller for the Zn2+ distribution than for the O+ distribution. This agrees with the picture that the zinc dications are localised towards the front edge of the ablation plume. In addition, the mean velocities obtained from the transients in velocity space are in close agreement with the velocities deduced from the raw TOF transients, validating the TOF-velocity conversion.
The slow tail of the zinc atom distribution exhibits an apparent acceleration, as can be derived from Figure 5.7. This apparent acceleration could have (at least) two origins. It could indicate a genuine acceleration of the zinc atom distribution, or it could be an effect of the way the data are recorded. These TOF transients are a measure of the emitting species in the plume at different distances. Any depletion or decay process (e.g. radiative decay) will have more time to reduce the distribution of slow moving species before they reach the observation window; the 'mean' velocity of the observed distribution will thus appear to increase. This effect is also dependent on the distance of the viewing column, since the particles will need increasingly longer times to reach the viewing column with increasing distance. This will leave the slow species underdetected compared to the faster species and the discrepancy will increase with increasing distance.
To investigate the importance of either of the aforementioned effects, acceleration and decay, we have plotted the total signal recorded in different velocity bins for the different distances. We concentrate on measurements in the region of the slow velocity distribution (< 7 km/s). The results are shown in Figure 5.12.
Figure 5.12: The total Zn* emission signal in different velocity bins averaged over three different measurements for an applied laser fluence of 20 J/cm2.
The distance dependence of the signal in the different velocity bins does not follow the behaviour that might be expected from a radiative (or other) decay mechanism, namely an exponentially decaying function, rather we find that the total signal in the velocity bins peaks at a given distance before decaying. The total signal for higher velocity bins peaks at an increasing distance, consistent with a genuine acceleration of the slow distribution of emitting Zn* species.
This distribution, which we presume to reflect the nascent Zn+ distribution, will have to be deconvoluted. The method employed assumes that the zinc and oxygen cations have the same 'fast' velocity distributions, as illustrated by the TOF transients presented in Figure 5.9. If we assume that the velocity distributions are the same (within experimental error) we can deconvolute the total Zn* signal by simply subtracting a weighted transient resembling the O* distribution. The mean velocity of the resulting slow component of the Zn* distribution was calculated by finding the centre of the integrated signal, and the results verified by fitting a split gaussian to the distributions. The resulting velocity and the FWHM are plotted, as a function of distance, for four different fluences, in Figure 5.13. The acceleration obtained for the slow zinc ion distribution is relatively insensitive to the fluence; indeed the differences in acceleration derived for the different fluences are within the errors arising from the deconvolution procedure. Assuming a linear correlation between the mean velocity and time yields values in the range 5-10 ´ 106 km/s2 for the acceleration.
Figure 5.13: Velocity versus distance plots for the slow accelerating distribution prevalent in the zinc emission line at 481.2 nm, for four different incident fluences: a) 5 J/cm2 b) 10 J/cm2 c) 15 J/cm2 and d) 20 J/cm2. The dashed lines show the linear fit to the FWHM of the curves and the solid line is the linear fit through the experimentally determined COM velocities.
The implied velocity at the target surface (the y-intercept in Figure 5.13) and the velocities and the FWHM velocity spread at different distances are summarised in Table 5.3. The initial velocities scale with the fluence. These ejection velocities correlate with a surface temperature in the case of Knudsen layer formation, according to the following equation :[12]
|
|
(5.1) |
where k is the Boltzmann constant, hK is a heat capacity dependent parameter, m is the mass of the particle (Zn), v is the velocity of the particle and Ts and TK are the temperatures of the target surface and the Knudsen layer. The value of |hKTK/Ts| (=2.52) can be calculated from thermodynamical parameters.12
The calculated temperatures are 700 K for the fluence of 5 J/cm2 to 2200 K for the fluence of 20 J/cm2. For comparison, the melting point of metallic zinc is 692 K. Thus the data are consistent with the idea that the zinc particles at low fluences are ejected from a zinc melt, which is heated up at higher fluences to a temperature near the critical point (Tc,Zn = 3800 K).20
|
Monitored Species |
Fluence |
Velocity (m/s) Target surface |
Velocity / Spread (m/s) at 5 mm |
Velocity / spread (m/s) at 10 mm |
|
Zn* |
5 J/cm2 |
670 ± 240 |
3860 / 2450 |
7050 / 4250 |
|
|
10 J/cm2 |
670 ± 110 |
3140 / 1900 |
5600 / 3050 |
|
|
15 J/cm2 |
860 ± 90 |
3580 / 2130 |
6300 / 3500 |
|
|
20 J/cm2 |
1180 ± 20 |
3130 / 1860 |
5080 / 2600 |
Table 5.3: Velocity and acceleration of the slow distribution of the zinc neutral emission according to the plots in Figure 5.13.
The detailed TOF analysis of the emissions accompanying the ablation plume arising from zinc oxide shows that the plume consists of three components namely a fast distribution attributable to Zn2+ ions in the plume, a slower component attributable to the O+ and Zn+ ions in the plume and a slow accelerating component apparent only in the Zn* emission that we also attribute to Zn+. The data can be interpreted in the following way: The observed optical emission, in part at least, is a product of the interaction of the laser light with the ablation plume. The occurrence of fast Zn2+ ions (correlated with Zn+ emission) is consistent with the assumption of laser-plume interaction. The occurrence of an O+ and Zn+ distribution (correlated with O and Zn emissions, respectively), with similar COM velocities, indicates a hydrodynamic, velocity-equilibrating regime. Both distributions are assumed to be emitted by the zinc oxide lattice.
A second distribution, associated only with slower Zn+ ions, shows accelerating behaviour that can be attributed to an electrodynamic effect in the plume. The calculated ejection velocities suggest that these ions are ejected by a melt of metallic zinc. This reflects the way the experiment is carried out, i.e. the ablation emanates from a pre-ablated track, which is enriched in zinc, as will be reported in section 5.3.4. The results are in accordance with an earlier TOF-mass spectrometer study of ZnO ablation with KrF laser excitation at fluences in between 0.4 and 2.5 J/cm2.10 This study also identified plume splitting and acceleration, for the Zn+ distribution only. The obtained results were discussed in the framework of Coulomb explosion and will be discussed further in section 5.3.6.
The acceleration of at least a part of the plume has interesting consequences and will be investigated further by an independent measurement, namely Langmuir and ion probes.
5.3.3. Langmuir Probe transients in vacuum
The plasma was additionally studied with Langmuir/ion probes. The probe voltages were set to + 10-20 V to ensure that the probe is operating in the electron acceleration region. The transient electron density was studied at distances of 3 - 9 cm from the target surface and at fluences of 5-20 J/cm2. Typical currents, summed over 30 laser shots, with the probes biased at different voltages to ground at 3 cm from the target for a fluence of 10 J/cm2 are given in Figure 5.14.
Figure 5.14: Probe currents at different voltages recorded with a delay on the oscilloscope of 1 ms, measured at 3 cm from the target surface and a fluence of 10 J/cm2. The spike at 1 ms is correlated with signal arising from scattered light of the target hitting the probe and inducing a current via the photoelectric effect, it shows the onset of the laser-material interaction.
Clearly at these voltages, the ion current does not have the same shape transient as the electron current. The ion current is dependent not only on the amount of ions in the plasma but also on the electron temperature, as shown in Chapter 2. The electron temperature is higher in the high velocity part of the plume, as indicated by the presence of Zn2+ ions in this region. This also implies that the ion current is overestimated in the front part of the plume, which is a possible explanation for the differences in the measured probe currents. Additionally the ion current at lower applied voltages shows a double peak, reflecting the behaviour correlated with the electrons. The measured electron current is assumed to be in the electron acceleration regime. This assumption is verified by plotting the square of the electron current versus the probe potential for 20 different voltages in the range of 10 - 20 V, and calculating the square of the correlation coefficient (R2) of the obtained curve. This is shown in Figure 5.15 and the interpretation of such measurements is discussed in detail in reference [13].
Figure 5.15: (b) Electron currents at different probe voltages in the range of 10-20 V as also shown in Figure 5.14 and (a) the time dependence of the R2 value calculated assuming a linear voltage-(current)2 relationship.
Figure 5.15 indicates an excellent linear relationship between the square of the probe current and the voltage in the region where the probe current is measurable above the noise level. The region with the smallest correlation coefficient is the rising edge of the current plot, possibly reflecting shot-to-shot variations in the fluence and the target surface.
The electron current was studied in this way for eight different fluences and the measured TOF converted into velocity space. A number of the original TOF distributions and their corresponding velocity distributions are given in Figure 5.16. The mean velocity and the FWHM can be calculated from these converted velocity distributions. The figures are given in Table 5.4.
The calculated mean velocities and the FWHM’s scale with the applied fluence, though the increase in velocity is small compared to the increase of applied fluence. Noticeable in the TOF and velocity distributions is the existence of a small peak correlated with a fast electron distribution. This fast electron distribution travels ~45 km/s and is apparent in all the measured transients. These deduced velocities can be compared with the data obtained via OES, although care has to be taken in the comparison since the techniques measure inherently different quantities. With OES, the transient behaviour of a radiative decaying transition of a selected atom or ion is measured close to the target, while the Langmuir probe reveals the transient behaviour of the total electron density at larger distances from the target. The mean velocities measured with the Langmuir probes closely resemble those measured for the emitting zinc and oxygen atoms (which we associate with nascent Zn+ and O+ ions), while the velocity of the fast electron distribution resembles that measured for the Zn+ emission (i.e. the nascent Zn2+ ions). The mean velocities measured with the Langmuir probe assembly are higher than the mean velocities deduced via optical emission spectroscopy and their FWHM are smaller. Overall, the Langmuir probe transients show a rather complex behaviour, correlated with the ablation of multi-component species. The Langmuir probe transients are assumed to consist of (at least) three contributions. The electron distribution comprises a component that is loosely coupled (via ambipolar diffusion) with the expanding Zn2+ ions, another coupled with the expanding Zn+ and O+ distribution and, presumably, a third slow component loosely coupled with the expanding slow Zn+ distribution. Because of this complexity, no deconvolution has been performed on these data. Important to note is that the relative height of the fast peak in the TOF distribution increases with increasing fluence consistent with the noted fluence dependence of the Zn+* emission (and thus the Zn2+ formation). A comparison with a study for a monocomponent material (Al, given in appendix 1) can be made.
Figure 5.16: (a) TOF and (b) velocity distributions for electrons measured at four different fluences at 3 cm from the target surface. The TOF profiles are all recorded so that t=0 (i.e. the instant when the laser is incident on the target) appears at 1.0 ms.
|
Fluence (J/cm2) |
Velocity (km/s) |
FWHM (km/s) |
|
5 |
13.3 ± 0.2 |
4.5 ± 0.1 |
|
7.5 |
14.3 ± 0.7 |
5.1 ± 0.6 |
|
10 |
15.8 ± 0.1 |
5.9 ± 0.1 |
|
12.5 |
17.1 ± 0.5 |
7.1 ± 0.6 |
|
15 |
16.7 ± 0.5 |
6.4 ± 0.9 |
|
17.5 |
17.8 ± 0.3 |
7.4 ± 0.3 |
|
20 |
18.3 ± 0.6 |
8.1 ± 0.8 |
Table 5.4: Mean velocity and FWHM of the electrons (deduced from the centre of the integrated distribution) at different recorded fluences and with the probe-target distance of 3 cm. The error bars represent the standard deviation of at least three independent measurements.
This apparent plume splitting into two, or more, components has also been noted in the ablation in vacuum of copper 13,14, iron [14] and graphite [15] at similar fluences and distances to our work and a short discussion of plume acceleration observed in the case of aluminium ablation is also given in appendix 1. The explanation provided for this behaviour is based on the existence of fast, hot electrons in the plume. The mechanism for creation of these fast electrons involves laser-plume interactions. The laser photons can heat up the electron distribution directly, via inverse Bremsstrahlung. Hot electrons situated at the front of the plume can escape the plasma plume, due to the lack of energy equilibrating collisions.[16] This causes a high positive potential, which in turn accelerates ions in the plume to higher energy. These ions will rapidly reach the same average velocity as the electrons. Because of the low collision rate the ion and electron clouds will actually oscillate through each other’s position. After the interaction the forward velocity of the ion and electron cloud should ultimately become equal.
The acceleration of a part of the ablation plume has been identified via TOF-OES at small distances from the target surface. To investigate the extent of any acceleration at larger distances from the target surface we have performed electron probe measurements at different distances for a given fluence of 20 J/cm2. The results are summarised in Figure 5.17.
Figure 5.17: (a) A plot of the mean electron velocity versus distance for a fluence of 20 J/cm2 together with (b) various of the corresponding Langmuir probe measurements at four different distances, 3 cm, 4 cm, 5 cm and 6 cm at the given fluence. The four plots in (b) are on a common vertical scale.
The whole electron distribution accelerates, as can be derived from Figure 5.17. The mean velocity versus distance plot indicates that the acceleration gradually dies out at distances > 7 cm from the target. Figure 5.17 also illustrates that the total signal does not attenuate significantly with increasing distances. This has also been described in other studies investigating double layers in ablation plumes.14 The observation has been attributed to a self-focusing effect of the electron/ion distribution apparent in accelerating ablation plumes, which results in a highly forward-peaked distribution for the ions/electrons.14 Alternatively, however, we note that it could also be due to the increased Debye length at larger distance and thus lower number densities. The validity of either of these effects will have to be checked by future studies involving an angular dependent study or time gated OES with a CCD-camera. Also noticeable is that the FWHM of the electron distribution is not greatly affected by the acceleration. To study the dependence of the acceleration on the fluence we have also studied the distance dependence of the mean velocity at a number of different fluences. The results are summarised in Figure 5.18.
Figure 5.18: Acceleration of the plume given at different probe distances: 3, 7 and 9 cm. The dashed line shows a third order polynomial fit through the data for 3 cm.
The acceleration and the asymptotic velocity scales with the fluence, as expected. The higher the laser power input, the higher the fraction of fast electrons and the higher the mean electron velocity. The acceleration over the range of 3 to 7 cm is around 20 % for the lowest fluence, increasing to ~ 40% at the highest fluence studied. The fluence increase induces an increment of the fraction of Zn2+ ions and fast electrons, giving the incline in the mean electron velocity by changing the ratio of the fast (coupled with Zn2+) and slower electrons.
The analysis of the plume with Langmuir probes reinforces the conclusions of the OES study that, at least, a part of the plasma component of the plume is accelerating, due to a fast, decoupled electron component. The fast electron distribution is observable with the Langmuir probe transients and its velocity is ~45 km/s. The electron distribution within the plume accelerates even at distances of 3 – 7 cm from the target surface, although the acceleration is much less pronounced than the acceleration observed closer to the target surface. This observation is in accord with the assumption that this acceleration has an electrodynamic origin. The almost negligible signal attenuation observed when measuring at increasing distances can be attributed to either a self-focusing effect within the plume or a compensation effect whereby the reduced number density at larger distances is offset by the increase in Debye length.
Combination of the TOF-OES and Langmuir probe studies shows that the nascent Zn+ distribution and, at least at later times, the total electron (and thus ion) distribution accelerates under the influence of an electric field in the plasma generated by laser-plume interactions. This behaviour appears to be quite general for ablation of metals at high fluence (5-20 J/cm2) and even graphite (at higher fluences: 10-25 J/cm2). A discussion of the ablation behaviour of aluminium under the same conditions, included in appendix 1, serves to confirm these results.
5.3.4. Target morphology
The surface of the ZnO target changes drastically under the influence of laser irradiation. The irradiated part of the white-yellowish target surface becomes grey after a single laser shot, in accordance with observations reported in reference 10. This is an indication of a non-congruent evaporation mechanism during ablation leaving the target surface zinc enriched. Figure 5.19(a) shows a low magnification picture of the ZnO surface after laser ablation. Three regions are distinguishable in this figure, namely the region modified directly by the laser irradiation, a second region characterised by an indirect surface modification and the third, the apparently unaffected, region of the target surface.
b) a)

Figure 5.19: SEM pictures of the zinc oxide surface (a) low resolution image of the zinc oxide target surface, the ablation region is indicated by the arrow, (b) higher resolution image of the boundary between the ablated and heat affected zone (horizontal bar = 20 mm), (c)-(d) higher resolution images of non ablated and the ablated areas, respectively.
d)
In higher detail (Figure
5.19(b)-(c)-(d)) the unaffected region exhibits a
crystalline structure with clearly distinguishable crystal facets, while the
indirectly modified region exhibits a smoother structure with evidence of
resputtered droplets on the surface.
The surface structure of the laser irradiated region has a very smooth
appearance. These observations can be
explained as follows: The laser irradiation induces local heating, melting and
ablation not only of the directly irradiated region, but also of the neighbouring
region both via heat conduction in the solid target and by interaction with the
lower intensity edges of the incident laser pulse. The irradiated region is ~400 mm wide, consistent with
the focused laser beam width, the heat conduction affected zone extends for a
further ~100 mm. Figure
5.19(d) suggests that the depth profile of the ablated
region includes regions with differing conductivity, as indicated by the
different greyness of the two regions.
c)
In addition, the composition of the surface was
analysed by X-Ray microanalysis and gives the figures shown in Table 5.5. The X-Ray
microanalysis system is calibrated with a virgin target surface, which is
assumed to comprise 1:1 stoichiometry.
The analysis was performed with 20 keV electrons, the penetration depth
for this kinetic energy is highly material dependent, but an often-stated value
for the penetration depth for crystalline solids is ~1 mm. The figures indicate a high zinc enrichment
in the ablation track and the heat affected zone, and the figures are in
agreement with the SEM pictures. This
surface layer is thus assumed to consist of highly zinc enriched ZnO or a
metallic zinc layer on top of the zinc oxide lattice.
The figures for the surface stoichiometry also indicate some zinc enrichment far from the ablation track. This is assumed to be attributable to redeposition of zinc droplets on the target surface.
|
|
Zn % |
O % |
|
Virgin target |
50.0 |
50.0 |
|
Unablated Area |
59.9 |
40.1 |
|
Indirect surface
modification |
64.5 |
35.4 |
|
Ablated area |
66.0 |
34.0 |
Table 5.5: X-Ray microanalysis figures of the Zinc and oxygen content in the films.
The removal rate was calculated from mass loss studies and yielding values of 0.13 mg/shot for 5 J/cm2 and 0.31 mg/shot for 20 J/cm2. This gives an ablation rate of ~1 - 5 ´ 1015 atoms/shot and, assuming a density of 5.675 g/cm3 and a spot size of 0.4 ´1 mm2, implies a crater depth of ~ 60 - 300 nm /shot.
5.3.5. Optical emission and ion probe measurements in background gas
The plume properties in a small background pressure of O2 were investigated at a fluence of 10 J/cm2 by TOF measurement of the 776.9 nm O* emission at small distances from the target surface (< 15 mm) and, additionally, at distances comparable with the deposition distance (5 cm) via Langmuir probes. The time integrated wavelength dispersed spectrum in these low background pressures of O2 showed no significant differences from the spectrum obtained in vacuum.
The TOF-OES distributions for three different distances from the target surface are shown in Figure 5.20 with the corresponding distance versus time plot at a background gas pressure of 10 mTorr. The mean velocities deduced from the TOF profiles can be compared with the velocities deduced for ZnO ablation in vacuum and indicate that the emitting O* component of the plume propagates in 10 mTorr of background O2 with a comparable velocity to that in vacuum. Comparing the total emission intensity versus the distance (Figure 5.20) shows that the total signal drops significantly faster in the presence of added background gas than in vacuum. The quenching of the total signal can be explained as follows: The excited oxygen distribution in a small background pressure will decay radiatively, by emission of a photon, or non-radiatively, by collisional energy transfer to another atom/molecule (most probably the background gas). Those oxygen atoms that collide with the background gas molecules have less chance of being observed in optical emission. These atoms are also the ones that are most likely to transfer momentum to the background gas. That the O* emission shows the same propagation velocity in 10 mTorr O2 as vacuum may well reflect the fact that the observed emitting atoms in both cases are those that have managed to avoid collision prior to emitting. The fact that the forward directionality of the ablation plume is little affected by addition of small amounts of background gas at distances < 5 cm has been recognised in earlier studies, and is reviewed in reference [17].

Figure 5.20: (a) TOF-OES emission spectra of O* emission at 776.9 nm for 10 J/cm2 and 10 mTorr O2 background pressure (1 ms delay on the oscilloscope), (b) distance versus time plot compared with the data in vacuum. (c) Total signal versus distance plot for the O* emission following ablation 10 J/cm2 of ZnO in vacuum and in a background pressure of 10 mTorr O2. The curves in (c) are first order exponential curves (of the form y = y0+A e (-x/t)), the value of the exponential factor t was 2.3 in the case of vacuum ablation and 1.6 in the case of ablation in 10 mTorr, quantifying the faster decay of the emission in background gas compared to vacuum.
The ablation plume was also studied with Langmuir probes as described earlier, as a function of added O2 pressure. The TOF transients and velocity converted profiles for the electrons are given in Figure 5.21. These transients were recorded successively, at different O2 pressures, under otherwise identical experimental conditions. Two effects are observable, namely an increase in electron current with increasing O2 pressure and a complicated redistribution of the velocity distribution with part slowing and part increasing in velocity.
The increase in electron current when ablating in a background gas indicates ionisation of the background gas molecules. This ionisation occurs when the high kinetic energy atoms, arising from the ablation event, collide with the background gas molecules. The mean kinetic energies derived in vacuum for the Zn ions are 50 eV for the Zn+ ions (measured by Zn* emission) and 305 eV for the Zn2+ ions (measured by Zn+* emission). These kinetic energies are more than sufficient to obtain the observed additional ionisation of the background gas (total electron density ~ 2 times larger than in vacuum). The fast end of the electron distribution, associated with the Zn2+ ions, appears to grow in importance with increasing pressures of O2, but the mean velocity decreases. The slow part of the electron distribution propagates with similar mean velocity, but the FWHM of this part of the distribution increases substantially with addition of background gas. This is attributable to the well-known 'snow-plough' effect of the ablation plume.[18] While propagating through a background gas, the ablation plume pushes the background molecules forward, thus giving a forward velocity to the background gas. The FWHM of the total ion signal is expected to increase as a consequence of this effect.
Figure 5.21: Langmuir probe transients of electrons in the plume resulting from 193 nm ablation of ZnO in a background pressure of O2 recorded at a distance of 3 cm.
5.3.6. Conclusions from studies of the 193 nm pulsed laser ablation of zinc oxide
The ablation of zinc oxide has been studied in vacuum and small pressures of O2 background gas. Existence of zinc cations and dications and oxygen cations in the ablation plume has been inferred from studies of the time integrated optical emission. These ionic products are considered to be generated largely, if not exclusively, by laser-plume interactions. The intensities of the zinc and oxygen atom emissions depend linearly on the applied laser fluence while the zinc ion emission depends non-linearly on the laser fluence and shows an apparent threshold of ~ 10 J/cm2.
Time differentiated OES shows that the ablation plume can be divided into (at least) three components, a fast Zn2+ ion component, a component correlated with the congruent formation of Zn+ and O+ ions and a component correlated only with the formation of slow Zn+ ions. The latter component is deduced to be accelerating as it evolves away from the target. This acceleration behaviour is confirmed with the Langmuir probe assembly. The acceleration scales with the applied fluence, and has ceased by distances ~7 cm. Such behaviour was also noted and discussed 10 in an earlier TOF-mass spectrometer study of ZnO ablation in vacuum with 248 nm laser excitation at fluences between 0.4 to 2.5 J/cm2. The zinc atom distribution observed in this earlier work at low fluences (0.4 - 0.7 J/cm2) showed an increasing kinetic energy from 1 to 4 eV with increasing fluence; these energies were attributed to an electronic ejection mechanism. The zinc ion distribution was seen to exhibit double peak behaviour at fluences above 0.7 J/cm2, which was identified as the plasma formation threshold. This double peak behaviour was attributed to the existence of Zn2+ ions in the plume ejected by lattice defects (doubly ionised F-centres). These Zn2+ ions could, in turn, recombine to form Rydberg states which would be detected as emitting Zn+ ions. The ejection of Zn2+ ions is also considered to cause acceleration of the plasma via a Coulomb explosion mechanism followed by charge transfer and neutralisation. The existence of Rydberg states in the ablation plume was inferred by comparison of the kinetic energy distributions of the detected Zn+ and Zn2+ ions and, additionally, by photoionisation using the output of a pulsed frequency doubled YAG laser operating at 0.25 J/cm2; as here, their formation was attributed to third body recombination in the plume. The behaviour of these Rydberg states was comparable with the behaviour of the parent ion.
When comparing the two sets of results it is important to note that we work at a higher photon energy and higher fluences, and that we specifically sample the decaying Rydberg states with OES and the total ion distribution with the Langmuir Probes. The observation that the Rydberg atoms show basically the same behaviour and velocity as their parent ion validates our assumption of treating the emitting states as probes for the respective parent ions. In our study we observe analogous double peak behaviour, although in our OES studies we are specifically probing radiating states derived from the Rydberg states. Since our study is in a higher fluence region, we assume that, because of laser-plume interaction, some species originally formed in the ground state will have undergone photoionisation, recombination, Rydberg formation and subsequent optical emission. Our results suggest that the ejection mechanism for the accelerating zinc ion distribution is more related to ejection from a zinc melt rather than electronic ejection from defect sites in the ZnO lattice. Additionally, the whole plume undergoes an acceleration due to electrodynamic effects in the plume; this we tend to attribute to a development of a double layer at the expanding front of the plume, associated with fast, hot electrons rather than a Coulomb explosion mechanism.
The difference in fluence employed in the two studies may be a contributing factor for the differences in proposed ion ejection mechanism. Applying a high fluence will obviously have a more devastating effect on the target surface composition, and conceivably, would increase the zinc enrichment. Indeed, there will likely be a fluence threshold where the dominant ejection mechanism switches from ejection from defect sites in the ZnO lattice, to ejection from a zinc melt.
Detailed analysis of the post ablated area reveals that the target surface is zinc enriched and that the ablation track has a surface layer of zinc enriched zinc oxide or metallic zinc on top of the zinc oxide lattice. The zinc enriched surface is created either by preferential oxygen ejection or by Zn redeposition.
The velocity of the emitting species in the ablation plume in not significantly affected by the introduction of small pressures of oxygen background gas (5-10 mTorr). A TOF-OES study of the oxygen emission shows no deceleration of the emitting oxygen atoms within the plume, although comparison of the signal intensity versus distance decay rate in O2 and in vacuum ablation suggest that atoms which undergo collisions, and thus might be decelerated, are also quenched and thus no longer contribute to the observed emission. The LP studies reveal that the electron density in the ablation plume is ~ 2 times higher when ablating in a small background pressure of oxygen, indicating additional ionisation of the background gas molecules. The fast end of the electron distribution (correlated with the Zn2+ ions) is slowed (35 km/s as compared with 55 km/s in vacuum). Because of the mass of the Zn atoms, this part of the plume has a huge kinetic energy (in vacuum = 305 eV) and can easily ionise the background gas molecules via momentum transfer. The slower part of the electron distribution is seen to be much broader in a background pressure compared with in vacuum. This is attributable to the 'snow-plough' effect 18 observed in laser ablation, where the ablation plume transfers part of its forward momentum to the background gas and sweeps it in front of the plume of ablated material.
5.4. Pulsed laser deposition of zinc oxide and properties of the resulting films
Zinc oxide deposition was studied in vacuum and in small background pressures of oxygen gas (0 - 10 mTorr) over the temperature range of RT – 500 °C. The influence of the different ablation parameters on the resulting film properties was studied. A laser fluence of 10 J/cm2 was chosen for all of these studies. The films were analysed by UV-VIS absorption spectrometry, Scanning Electron Microscopy (SEM), Transmission Electron Microscopy (TEM), Atomic Force Microscopy (AFM), X-Ray Diffraction (XRD), Photo-Luminescence (PL) and Laser Raman spectrometry. Films were deposited on quartz and on silicon.
5.4.1. Dependence of parameters on deposition conditions and film properties
The dependence of the film properties on the ablation parameters can be investigated by use of XRD, planar TEM, UV-VIS absorption, PL, Raman Spectroscopy, AFM and SEM. XRD provides macroscopic information, while planar TEM gives microscopic information, about the crystal structure. UV-VIS absorption and PL provide information about the electronic structure of the deposited films while Raman spectroscopy gives a picture of the phonon modes in the film material. SEM and AFM reveal details of the surface structure of the films. All films are grown for 15 minutes (9000 laser shots) unless stated otherwise.
5.4.1.1. UV-VIS
The UV-VIS spectra of the deposited films under different growth conditions are given in Figure 5.22. The influence of the background gas, the substrate temperature and the effect of post annealing have been studied.
Figure 5.22: UV-VIS spectra of ZnO films deposited under different conditions: (a) the dependence on the background pressure and the temperature, (b) the dependence on different background gases O2 and N2, films grown at a substrate temperature of 500 °C and 10 mTorr of background gas and (c) the dependence on post-deposition annealing (5 hours / 800 °C / air), original film grown at room temperature in vacuum. The step observed in (a) is an artefact created by switching lamps in the UV-VIS spectrometer.
As Figure 5.22 illustrates, the UV-VIS absorption is very dependent on the background pressure. Films deposited in vacuum have a significant, continuous absorption in the visible range, demonstrating the presence of a considerable amount of metallic zinc in the deposited films grown under these conditions. The metallic zinc can be incorporated in the film as droplets or as domains of metallic zinc co-deposited with zinc oxide. The increase in transmission at energies above the band gap of films grown at higher temperature, but still in vacuum, is likely to be related, in part, to a decrease in film thickness. The introduction of background gas improves the film quality greatly. Films deposited in a low pressure of background O2, at various temperatures, show no decrease in absorption at energies above the band gap (Figure 5.22(a)). This suggests that the film thickness does not decrease as in the case of vacuum deposition, but that any metallic Zn within the films largely oxidises in the presence of the background O2. To have a better understanding of the influence of the background gas, we compared deposition in a background gas of oxygen and nitrogen under the same conditions. The background gas can affect the film properties in two ways. First, it can reduce the amount of droplets incorporated in the film, by retarding the particulates ejected from the target. If the pressure is high enough, these particulates do not reach the target surface.[19] It will be illustrated in the SEM results (section 5.4.1.2) that the particle density in the films is substantially reduced when depositing in a background pressure. A second effect of the background gas is to react with material in the ablation plume and/or with the deposited film. Obviously, in the present case we only anticipate any such reactions with added O2. The absorption results given in Figure 5.22(b) suggest a convolution of the two effects; N2 addition does improve the film quality, but there is still some continuum absorption at energies below the band gap. The absorption at frequencies above the band gap also indicates that the films grown in an N2 atmosphere are thinner than those grown in O2. The ZnO band gap is observable as a sharp feature at ~3.4 eV in the absorption spectrum of the highest quality films (400-500 °C / 10 mTorr O2) and the transmission in the visible region is >90 %.
The effect of post ablation annealing in air at 800 °C for 5 hours of a film originally deposited at room temperature (RT) and under high vacuum has been studied also (Figure 5.22(c)). The post-annealed film shows a much improved UV-VIS absorption. This post ablation annealing process indicates that the films can absorb O2 post-deposition (at high temperatures) to reduce the defects in the lattice. This indicates that the films are thin and porous enough to absorb oxygen at the grain boundaries -these being assumed to be the preferential location of the visible light absorbing defects.
5.4.1.2. SEM
The deposited films have also been analysed by SEM imaging. Images of films grown under different deposition conditions are shown in Figure 5.23. The films deposited in vacuum are smooth on a ten nanometer scale, but show a large number of embedded particulates. These particulates are a side product of the explosive boiling process at the target surface and deposit on the substrate with high kinetic energies.[20]
The number of particulates is reduced greatly by introducing a background pressure. This is in accordance with the idea that the large particulates will be slowed sufficiently in a background pressure not to be deposited.19
Deposition at elevated substrate temperatures leads to hollows in the deposited films. The hollows are assumed to be remnant craters caused by impacting large particulates. Presumably high substrate temperatures either encourage evaporation of the large particulates (Tm of Zn = 692.7 K / 419.5 °C) or the release of temporally accommodated particulates as a result of pressure build up by trapped gas pockets.
cracks hollows
![]()
![]()
![]()
Figure 5.23: SEM images of ZnO films deposited under different conditions: (a) no background pressure, (b) background pressure, (c) and (d) background pressure and 400 °C substrate temperature.
Films deposited at higher temperatures also show surface cracks. These cracks are presumed to arise during the cooling of the substrate, as a result of stresses in the film induced by a difference in thermal expansion coefficient of the substrate and the deposited film.
The film thickness was analysed by cross sectional SEM; representative images are shown in Figure 5.24. The films, deposited for 15 minutes, (9000 shots) have a thickness of ~ 200 nm, the high temperature deposited films show the same cracks as observed in the planar SEM pictures.
a) b)![]()
![]()
![]()
![]()
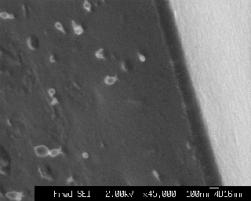
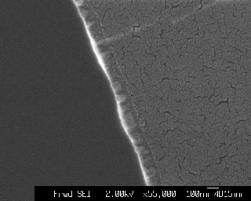
Figure 5.24: Cross sectional SEM images for ZnO films (a) deposited at RT and vacuum and (b) deposited at 400 °C and 10 mTorr. The arrows give an indication of the film thickness.
5.4.1.3. XRD
The crystallinity of the films was studied via XRD and TEM. XRD spectra of several films grown in vacuum at different temperatures are given in Figure 5.25(a). This figure clearly shows that the films exhibit preferential alignment at a substrate temperature of 400 °C. The main crystal growth axis is the (002) axis, with its ideal peak position at 17.263°, in good accord with the figures provided by other studies of laser deposition of ZnO.[21] No other XRD peaks attributable to ZnO are apparent in the spectra.
The effects of post-annealing and variation in background pressure were also studied and the results are shown in Figure 5.25 (b), and (c) - (d) respectively. At elevated temperatures, there is a large difference between the XRD spectra of films deposited in background pressure and in vacuum. Preferential alignment occurs in background pressures. The shift of the peak position is assumed to be related to the stoichiometry of the films. Films with a large deviation from the 1:1 stoichiometry have smaller (002) diffraction peak intensities. The stoichiometry and crystallinity of the films improves with higher O2 pressures, showing a shift towards the theoretical (002) value.
Figure 5.25: Selected XRD measurements for ZnO films grown under different deposition conditions. (a) deposition with 10 mTorr O2 background gas at given temperatures, (b) 2 films deposited at 400 °C / 10 mTorr, one film not annealed (Unann) and the other film annealed for 5 hours at 800 °C in air (Ann), (c) and (d) pressure dependence of the film quality at 200 °C and 400 °C, respectively. The diffraction angle associated with an ideal (002) surface is given as a dashed grey line.
The effect of post annealing is shown in Figure 5.25(b). Post annealing improves the film alignment only when the starting material is already aligned. This observation is in accord with the assumption that badly aligned films will need to undergo a bulk relaxation to obtain the preferential alignment. Post-deposition annealing at temperatures below the melting point of ZnO (Tm = 1974.8 °C [22]) does not provide a route for total bulk relaxation and reorientation.
Figure 5.26: XRD spectra illustrating the effect of substrate: (a) and (c) ZnO films deposited on silicon and quartz, together with their respective rocking curves (b) and (d). The curves through the data points in (b) and (d) are Gaussian fits and yield FWHM values of 1°for (b) and 2° for (d).
5.4.1.4. Planar TEM
The preparation of the films for the TEM studies reported here will be discussed in some detail. Given the high kinetic energies of the impacting particles, it is impossible to use a standard copper TEM grid with a thin DLC film (~10 nm) deposited above the voids of the grid. Rather than depositing on the DLC films, the ablated particles actually break it down. Thus, a different approach has been investigated in which a thin film is deposited on top of a DLC film deposited on mica. Since mica expands when inserted in water, the DLC film lifts off the mica surface and can be used as the substrate for planar TEM analysis. The same procedure without a DLC layer on top was tried also, but did not produce a free-standing ZnO film.
Since TEM can only be applied to intrinsically thin substrates the films were deposited for 2 minutes and at two different deposition temperatures, RT and 400 °C with 10 mTorr of O2 background gas. The film thickness can be estimated from the cross sectional SEM results (Figure 5.24) yielding a value ~15 nm. Figure 5.27 shows selected planar Bright Field TEM figures of the films together with their Selected Area Diffraction (SAD) patterns. The TEM images show a nanostructured film with single crystal sizes of 5 - 10 nm. This observation is in accordance with earlier reported results.[23] The SAD patterns, of selected parts of the film, investigated with the same magnification, have been arranged to have similar image intensities (by changing the exposure time of the camera). Comparison of the SAD patterns of the deposited films reveals that the diffraction ring related to (002) and (100) diffraction in the film deposited at RT disappears in the film deposited at 400 °C. This correlates with the observations from the XRD measurements that the films deposited at higher temperatures show a higher amount of structuring. The Bright Field images in Figure 5.27 show clearly that the RT grown film displays far less crystallinity than the film grown at 400 °C; this is in accordance with the XRD results. Note that the RT deposited film shows a large hole on the Bright Field picture, this is assumed to be an artefact in the film, the edges of the hole were actually used to focus on the surface.
Figure 5.27: Selected Bright Field TEM figures of the deposited films at (a) RT and (b) 400 °C together with their respective SAD patterns. The indices of the lattice diffractions are given for the SAD patterns.
Additional analysis can be performed by calculating the lattice spacing from higher resolution images by taking cuts through the diffraction patterns, as shown in Figure 5.28. The prominent diffraction fringes show separations of 2.81 Å and 2.46 Å, associated with the (100) and (101) crystal directions, respectively. No diffraction fringes with d = 2.61 Å, correspond to the (002) lattice spacing, were distinguishable, indicating that the (002) lattice direction is a minority in-plane growth lattice direction. Important to note also is that the images taken for the film grown at low temperatures do not exhibit a fully crystalline character. Although some crystalline domains are observable in the images, most of the image area consists of highly disordered material, from which it is not possible to produce a diffraction pattern.
Figure 5.28: Higher resolution TEM image showing a crystalline domain in the 400 °C film. Two cross sectional intensity plots obtained from the images, (a) one for the (101) crystal direction and (b) one for the (100) crystal direction.
The planar TEM and XRD images cannot be compared straightforwardly. They are complementary, planar TEM images yield information about the in-plane structure of the films, while the XRD data reveals the structure of the surface plane. The apparent lack of diffraction fringes correlated with the (002) lattice direction in the plane indicates that the (002) lattice direction is the prominent surface plane. The majority of the surface of films grown at RT shows a disordered or amorphous structure, in accordance with the observed lack of any peak in the XRD measurements. The measurements are in good accordance with TEM results from one recent study 23 although the SAD patterns in the former work seem to be saturated thus providing less quantitative information about the differences in lattice structure under different growth conditions.
5.4.1.5. AFM
AFM measurements of the surface topography of the ZnO film grown under the 400 °C, 10 mTorr O2 growth conditions are shown in Figure 5.29. The films appear to exhibit significant roughness, showing a variation in height of ~30 nm. The phase profile, obtained by tapping mode AFM, shows the presence of columnar structures ~50 nm in diameter, this columnar growth is also discussed in reference 23 and is correlated with the c-axis aligned growth.
a)
b)
Figure 5.29: AFM images of the same area on a ZnO film grown under 400 °C, 10 mTorr O2 growth conditions, (a) height profile and (b) phase profile.
The AFM images indicate a highly porous film which exhibits a columnar growth. The porosity of the film indicates that the films are nanocrystalline and suggest that many grain boundaries exist in the films. This picture accords with the figures obtained from the planar TEM images (Figure 5.27) and with the cross-sectional SEM images (Figure 5.24), both of which show surface structure of the order of tens of nanometers.
5.4.1.6. Raman and Photoluminscence
The Raman and PL spectra of ZnO films were recorded at the 325 nm He-Cd-laser excitation wavelength. Since this laser excitation wavelength is close to the band gap (350 nm) the spectra provide data on the UV resonant Raman scattering in the ZnO lattice.[24],[25] The resulting Raman spectra are given in Figure 5.30. The spectra are dominated by the LO (longitudinal) mode at 580 cm-1, of E1 symmetry, of a c-axis aligned ZnO crystal and its overtones (1165 and 1749 cm-1). These spectra are typical for c-axis aligned crystals. In monocrystalline samples as many as 7 overtones have been recorded.24 In the present ZnO films produced by laser ablation up to 3 overtones have been observed although the third overtone is barely distinguishable because of the strong band gap luminescent behaviour of these films. There is, to our knowledge, no prior information about resonant Raman spectroscopy on laser ablated thin films of ZnO. The Raman spectrum seems to be dependent on the quality of the film, poorer quality films exhibit weaker overtone signals.
Figure 5.30: Raman spectra for films deposited under different conditions, (a) vacuum / RT, (b) 10 mTorr O2 / RT, (c) vacuum / 400 °C and (d) 10 mTorr O2 / 400 °C.
Photoluminescence at room temperature was also studied following excitation at a wavelength of 325 nm. The results are shown in Figure 5.31. The spectra show an intense feature around 380 nm associated with band gap luminescence. The photoluminescence behaviour is highly dependent on the film quality. All four spectra are recorded with the same microscope and spectrometer settings, and the total luminescent signal for the different films is not normalised. The results show that the film deposited at 400 °C / 10 mTorr O2 exhibits the most intense and also the sharpest 380 nm luminescence while films deposited at lower temperatures and in the absence of background gas exhibit a weaker, broader luminescence peak related with band gap states. A second photoluminescent feature that is most pronounced in the high quality film is the broad luminescence centred around 510 nm. This green photoluminescence is related with band emission from deep interband levels, which are identified as either oxygen vacancies or zinc interstitials.[26], [27]
Figure 5.31: Photoluminescence of ZnO films deposited under the given conditions.
5.4.2. Effect of Aluminium and Gallium doping
The effect of aluminium and gallium doping was investigated by ablating sintered pellets of zinc oxide mixed with 5% aluminium or gallium. XRD spectra of films deposited at 500 °C / 10 mTorr O2 are given in Figure 5.32, while the UV-VIS spectra of films deposited under the same conditions are given in Figure 5.33.
Figure 5.32: Comparison between XRD spectra of films grown by ablating targets comprising 5% (a) aluminium and (b) gallium dopants in ZnO at 10 mTorr background pressure of O2 and at 500 °C. The vertical scaling is equal for both of the figures. The intense peak at ~69° is a reflection from the Si(100) substrate.
The displayed XRD spectra show the 2q angle in contrast with the former XRD figures. The peak at 34.4° agrees with the (002)-alignment of ZnO while the feature at 69.3° is a reflection of the Si(001) substrate. Interestingly, the XRD spectrum of the aluminium-doped film indicates a much less (002)-aligned film than the gallium-doped film. The reason for this observation might be that significant dopant concentration can affect the lattice structure in the film. Simply from size considerations, one might suspect a higher lattice distortion due to incorporation of the much smaller Al3+ ion (compared with Zn2+) than a Ga3+ ion. This will be discussed in more detail in section 5.5.4.
Figure 5.33: UV-VIS spectra of gallium doped ZnO film and a pure ZnO film deposited under the same conditions.
The optical band gap is little affected by the dopant concentration as illustrated in Figure 5.33. Doping with Ga, if anything, seems to shift the absorption edge to slightly higher energy. Both of the deposited films are ~ 90 % transparent in the visible region.
5.4.3. Conclusions and discussion of the deposition of ZnO films
The quality of the deposited film is highly dependent on the deposition conditions. Optimal deposition conditions for ZnO are 400 °C/500 °C and 10 mTorr of O2 background gas. The background gas not only prevents deposition of large droplets in the film, but also contributes to achieving more stoichiometric film formation (as shown by comparing the UV-VIS absorption spectra of films deposited in O2 and N2 background gas). Temperature is the most important parameter for film alignment. As discussed in reference 17, the substrate temperature necessary for lattice relaxation is ~0.3 Tm which, in the case of ZnO, is 592 °C (Tm = 1974.8 °C 22). Once again, we see that the high kinetic energy of the ablated particles allows deposition of highly aligned films at substantially lower temperatures than 0.3 Tm.
The studies of deposition on different substrates shows that
c-axis aligned or (002) growth is
actually not dependent on the substrate morphology. This shows that the growth is not epitaxially defined but that
the (002) surface is thermodynamically the most stable growth surface. The reason for the stability of the (002)
surface is still to be determined (see section 5.5). Previous
theoretical modelling suggests that the (100) surface should actually be the
most stable surface and that a significant fraction should rearrange as the
polar (001) and ![]() phase.[28]
phase.[28]
The surface structure is also highly dependent on the deposition conditions. Deposition in vacuum yields films with a large density of droplets or particulates, which are assumed to be created on the target surface as zinc droplets. These particulates can be largely eliminated by growing in a background gas, whereby gas dynamic effects cause retardation and stopping of these large particulates before they reach the substrate surface. Films grown on high temperature substrates show two kinds of defect structures; hollows and cracks. The hollows are assumed to be remnant impact craters of large particulates. The high temperatures either cause the large particulates to evaporate (Tm of Zn = 692.7 K / 419.5 °C) or are presumed to release the particulates because of pressure build up by trapped gas pockets. The cracks arise from the different temperature dependent expansion coefficients of the substrate and the deposited film. AFM revealed that the surface of the films grown under 400 °C/10 mTorr O2 conditions have a roughness of ~30 nm, exhibit columnar growth and are nanocrystalline (~tens of nanometers). This picture is consistent with TEM and high resolution SEM results.
The resonant Raman spectra show the LO phonon mode of the (002) surface and its overtones for films grown under all conditions, but the relative intensity of the different overtones is dependent on the film quality. The photoluminescence signal is very dependent on the deposition conditions, with the film grown under optimal conditions (400 °C/10 mTorr O2) showing green luminescence from zinc interstitials/oxygen defects as well as strong 380 nm band gap luminescence.
Doping the films with aluminium or gallium has been attempted using mixed Al:ZnO and Ga:ZnO pellets with 5% concentration of dopant. The (002) peak in the XRD spectrum of the aluminium-doped film almost disappears under growth conditions similar to those used to grow a highly aligned pure ZnO film, whereas this peak prevails in the gallium-doped film. This observation will be discussed in section 5.5.4. Ga doping has little effect on the optical band gap of the ZnO lattice, as shown via UV-VIS absorption spectroscopy.
5.5. Ab initio calculations
5.5.1. Bulk structure of the wurtzite structure
The crystal bulk structure was optimised by locating the relative O and Zn atomic positions at the wurtzite lattice positions, and then independently varying the c- and a-values of the unit cell of the hexagonal wurtzite structure using Hartree Fock (HF) and Density Functional Theory (DFT) levels of theory. The energy surfaces so obtained are given in Figure 5.34. The calculated values for the HF and DFT optimised bulk structures are given in Table 5.6.
Figure 5.34: Energy surfaces for the bulk geometry optimisations via (a) HF and (b) DFT calculations.
|
|
a (Å) |
c
(Å) |
c/a |
a (%) |
c (%) |
Charge (e) |
Energy (Hartree) |
|
HF |
3.285 |
5.245 |
1.597 |
-1.31 |
-0.97 |
1.62 |
-3705.430480 |
|
DFT |
3.310 |
5.190 |
1.568 |
-2.08 |
0.09 |
1.36 |
-3709.098675 |
|
Ref. 31 |
3.259 |
5.183 |
1.590 |
-0.51 |
0.23 |
- |
-3705.426610 |
|
Exp. |
3.243 |
5.195 |
1.602 |
- |
- |
- |
|
Table 5.6: Comparison of the optimised parameters obtained in the present work using HF and DFT calculations with the results of other theoretical calculations and with experimental values for the lattice parameters a and c. The third column shows the ratio c/a. The fourth and the fifth column indicate the percentage difference from the experimental values, the sixth column reports the calculated absolute Mulliken charges on the atoms and the last column gives the calculated total energy of the systems in Hartree.
Comparing the figures given in Table 5.6 shows that the calculated parameters agree with experiment to within an acceptable (~2 %) errors, although the HF optimised geometry has the c/a ratio closest to the experimental values. The calculated parameters are also in good agreement with values reported from former HF ab initio calculations.31 The basis set in our calculations is of better quality than that used in reference [31], as indicated by the total energy.
The Mulliken charges on the zinc and oxygen atoms show that the lattice has significant covalent character, manifesting itself by the large deviations in the charges from the ionic values (i.e. ± 2 e). Additionally, we note that inclusion of the effect of electron correlation (via the DFT theory) has a large impact on the atomic charges and makes the lattice even less ionic than predicted by the HF results.
The surface and doped structures reported hereafter have been calculated with the HF optimised lattice parameters since these parameters are in closest agreement with the experimental (a, c and c/a) values. Calculations were performed at both the HF and DFT level of theory, unless stated otherwise.
5.5.2. The non-polar (100) surface
The non-polar surfaces are the most straightforward to calculate and results of calculations on these surfaces have been reported previously.28,[32] We have calculated the energy of the non-relaxed non-polar (100) surface as a function of slab thickness. The results are summarised in Figure 5.35. The surface energy is found to be 1.48 J/m2 for the unrelaxed surface.
c
a![]()
![]()
Figure 5.35: (a) Surface energy as a function of the slab thickness, and (b) stacking sequence of (100) surface. The big spheres represent Zn and the small sphere O.
The (100) surface has also been investigated at the DFT level of theory,32 with relaxation taken into account. The relaxations for this surface are generally quite small and involve a modest contraction of the bond length (0.1 Å) of the surface ZnO dimeric units and a small buckling of the surface layer, which induces a tilt in the surface dimeric (ZnO) unit of 5° (the oxygen relaxes outwards and the zinc inwards). No surface energy was reported in this study.
5.5.3. The polar (002) surface
The most common surface structure obtained with laser ablation, as seen in section 5.4.1.3, is the polar (002) surface. Theoretical calculations on this surface could provide key information about the formation and the properties of these c-axis aligned films. Unrelaxed polar surfaces are inherently unstable, as discussed in Chapter 3. The surface will have to relax via a change in surface charge (charge transfer) to compensate for the overall dipole moment, or via a reconstruction that renders the surface defective. In apparent contradiction to such ideas, however, a recent computational study of this polar surface [33] has reported an energy minimum involving only relatively small geometry relaxations.
In this paragraph we will discuss the results of our HF/DFT
calculations within the framework of these other theoretical studies. To gain a better view of the relaxation, we
have calculated small slabs (2,4 bilayers) and optimised their geometry. The ZnO lattice has two different
terminations, namely the oxygen terminated ![]() surface and the zinc
terminated (001) surface. The picture
of the relaxation of these two surfaces is even more complicated, since these
surfaces are inherently different and so will relax in different ways. Theoretically, it is impossible to calculate
a surface energy for just one of these surfaces, since both the surfaces have
to be taken into account.
surface and the zinc
terminated (001) surface. The picture
of the relaxation of these two surfaces is even more complicated, since these
surfaces are inherently different and so will relax in different ways. Theoretically, it is impossible to calculate
a surface energy for just one of these surfaces, since both the surfaces have
to be taken into account.
5.5.3.1. Two-bilayer slab
The two-bilayer slab is characterised by the lack of bulk (or non-surface) layers to support the surface structure. Although this is, of course, not a physical model to describe the surface structure of nanometer thick ZnO films, a discussion of the calculations is given because it provides a simple introduction to the fundamentals of this polar surface.
A representation of the two-bilayer slab is given in Figure 5.36. The first approach to relaxing the structure involves moving the position of both of the outer layers or both of the inner layers along the c-axis relative to the bulk position and calculating the properties of these geometric arrangements. In this way we can study the effect of dipole moment on the energy and the electronic structure. The second approach to relaxing the structure is to optimise the system by independently displacing the four layers, where only geometry conserving displacements are allowed (along the c-axis). The distance between the Zn and O layer in each bilayer is 0.6 Å. We have investigated the displacements in which the outer layers are moved from 0 to -0.3 Å (inward relaxation) and inner layers moved from 0 to 0.3 Å (outward relaxation) relative to their bulk position. Clearly, such a movement of 0.3 Å (in absolute value) of both of the outer and inner layers relative to their bulk position leads to a planar structure.
Figure 5.36: (a) Representation of the two-bilayer slab and (b) the geometrical parameters for the bulk like structure, moving the inner layers 0.3 Å and the outer layers – 0.3 Å results in the planar geometry. The big spheres represent Zn and the small sphere O.
We have investigated the energy dependence on the former type of displacement, given in Figure 5.37. The minimum in this 2-parameter space is the planar geometry. This is also the only calculated geometry that does not exhibit a dipole moment. The plots show that the dipole moment has a very large effect on the energy. The relative energy difference between the two extremes, the planar structure and the bulk structure, of the computational grid is 0.1347 Hartree for the HF and 0.08502 Hartree for the DFT calculations. The relative DFT energy difference is about half the relative energy difference calculated at the HF level of theory, indicating that electron correlation plays an important part in the description of the electronic structure of this system.
Figure 5.37: Energy versus nuclear displacement for the 2-bilayer slab. The outer layer axis defines the absolute displacement of the outer layer, while the inner layer axis defines the absolute displacement of the inner layer in Å. The geometry where the x- and y-values are 0.0 corresponds with the bulk structure while the geometry with 0.3 for x- and y-values corresponds with the planar structure. The x- and y-axis are the displacement of the inner and outer layer, respectively, and the z-axis shows the energy of a given geometry, at (a) HF and (b) DFT level of theory. 'Inner' signifies displacement of the inner layers while 'Outer' signifies displacement of the outer layers.
The change in electronic structure has been investigated by calculating the Mulliken charges on the atoms. These Mulliken charges provide an estimate of the charge density and the changes in charge density induced by the displacements. The calculated charges on the atoms in the extreme cases of a fully planar geometry and an unrelaxed bulk geometry are given in Table 5.7. In the further discussion we introduce parameters that can be calculated from the Mulliken charge distribution. The charges on the atoms can be multiplied by the positions of the atoms and summed to yield a value for the dipole moment. The charge transfer between one bilayer and the other can be calculated by summing the charges on the atoms in each bilayer, and an average value for the covalency can be estimated by summing the charges on one species (e.g. the zinc atoms) and divide this charge by the number of atoms in the computational cell, here two. The smaller the resulting charge, the more covalent the lattice is. A value of ± 2 indicates an ionic solution, while a value of 0 indicates a totally covalent solution.
|
|
Geometry |
Zn outer |
O Inner |
Zn Inner |
O Outer |
|
HF |
Planar |
1.56 |
-1.56 |
1.56 |
-1.56 |
|
|
Bulk |
1.35 |
-1.49 |
1.45 |
-1.31 |
|
DFT |
Planar |
1.36 |
-1.36 |
1.36 |
-1.36 |
|
|
Bulk |
1.14 |
-1.33 |
1.27 |
-1.08 |
Table 5.7: Charges on the atoms (in units of e) for the two extremes of the calculation, the fully planar geometry and the geometry of the unrelaxed bulk structure.
The charges on the atoms (and correspondingly their covalent
character) are, for all bar one case, smaller than in the bulk calculations
(given in Table 5.6). The
exception is the case of planar co-ordination, at the DFT level of theory,
where the calculated charges are the same as their bulk values. In addition, the non-planar solutions to the
calculations show a charge transfer.
The outer Zn atom becomes less positive (correlating with partial
filling of the outer valence Zn band) and the outer oxygen atom becomes less
negative (which correlates to partial depletion in the outer valence O band).
This charge transfer corresponds to an induced dipole moment counteracting the
dipole moment associated with the bulk polar surface. Interestingly, the induced dipole moment serves to make the bonds
also more covalent. The charge transfer
between the oxygen terminated ![]() and the zinc
terminated (001) surface is |0.14| e
in the HF calculations and |0.19| e
for the DFT calculations. The charge
transfer between the two layers is correlated with the displacement of the
layers, as given in Figure
5.38.
and the zinc
terminated (001) surface is |0.14| e
in the HF calculations and |0.19| e
for the DFT calculations. The charge
transfer between the two layers is correlated with the displacement of the
layers, as given in Figure
5.38.
Figure 5.38: Plots of the charge transfer between the two bilayers as a function of nuclear displacement calculated at (a) HF and (b) DFT levels of theory. 'Inner' signifies displacement of the inner layers while 'Outer' signifies displacement of the outer layers.
The total charge transfer is mainly associated with charge transfer between the oxygen atoms. The charge difference between the inner and outer oxygen atoms (|0.13| e) is almost twice the value of the difference between the zinc atoms (|0.07| e) derived using DFT theory. Since the charges are calculated as a function of displacement (a computational parameter) we can also calculate the dipole moment along the c-axis from the Mulliken charges. The results are given in Figure 5.39.
Figure 5.39: c-axis dipole moment for the 2-bilayer slab as predicted from (a) the HF and (b) DFT calculations. 'Inner' signifies displacement of the inner layers while 'Outer' signifies displacement of the outer layers.
The calculated dipole moment is larger in the HF than in the DFT calculations, indicating that electron correlation helps to compensate for the original dipole moment arising from the polarity of the surface. This is also evident from the calculated charge transfer between the layers (Figure 5.38) and the energy of the polar solutions. Larger charge transfer is predicted by the DFT calculations, while the energy of the polar solutions is lower compared to the non-polar solution.
In addition, the geometry was optimised (energy minimised) in a 4-parameter space, namely the z-coordinates of the atoms of the four layers. The obtained values for the energy and electronic properties can be studied in this 4-parameter space to obtain a more general view of the way properties depend on each other. The calculated dipole moment can also be compared with that for the structures that would be predicted in the limit that there was no electronic relaxation, this latter dipole moment can be calculated from the product of the bulk charges (± 1.36 e) and the respective positions of the atoms. The two values have been calculated for all of the geometries investigated in this section and plotted against each other (Figure 5.40(a)). The correlation between the two values can be fitted well by a second order polynomial. This result might be considered surprising at first sight, since the correlation appears to hold for any calculated geometry. This implies that the induced dipole moment at any specific geometry (or set of nuclear positions) is related with the dipole moment it would have prior to relaxing the original wavefunction irrespective of the specific geometry. The second order relationship indicates that the induced dipole moment gains in importance as the dipole associated with the unrelaxed wavefunction becomes greater. In the upper limit of the calculations, the dipole moment of the relaxed wavefunction is 54% that of the dipole moment of the unrelaxed wavefunction. The correlations between the dipole moment associated with the relaxed wavefunction and the associated charge transfer and measure of covalency are given in Figure 5.40(b)-(c). As expected, the dipole moment correlates with the charge transfer, but the system also becomes more covalent because of the dipole moment.
Figure 5.40: (a) Plot of the relaxed dipole moment versus the theoretical dipole moment for an unrelaxed wavefunction. (b) and (c) show the correlation between the charge transfer, and the covalency, with the dipole moment of the relaxed wavefunction.
The correlation of the calculated energy of the system with these various defined parameters can also be studied. The dependence of the energy on the charges on the individual atoms is given in Figure 5.41. Clearly, the energy is most closely correlated with the charges on the outer Zn and O layers.
Figure 5.41: Dependence of energy on the charge on individual atoms. 'Outer' and 'Inner' defines an atoms in the outer and inner layers, respectively.
The energy dependence of the defined electronic parameters is shown in Figure 5.42. The energy increases with increasing dipole moment and (in absolute values) charge transfer. This indicates that it is energetically unfavourable to have surfaces with a large polarity, as stated previously, although the wavefunction tries to counteract the polarity by a charge transfer giving rise to an induced dipole moment. The energy rises with higher covalent character of the atoms. Surprisingly, we observe that the lattice can sustain a small dipole moment, resulting in a calculated energy minimum, which is not totally planar. The structure is resembles the planar structure except for the inner Zn layer, which has an inner displacement of 0.09 Å.
Figure 5.42: Energy dependence on electronic parameters, namely (a) dipole moment, (b) charge transfer and (c) covalency.
5.5.3.2. Four-bilayer slab
The four-bilayer slab was also investigated
theoretically. This structure is the
smallest slab that has a unit cell as a bulk layer as Figure 5.43 shows (for an unrelaxed structure). For the four-bilayer slab the surface
structure of the two surface bilayers (![]() oxygen terminated and (001) zinc terminated surface) was optimised
while the structure of the two inner bilayers was held fixed at the geometry of
the bulk structure.
oxygen terminated and (001) zinc terminated surface) was optimised
while the structure of the two inner bilayers was held fixed at the geometry of
the bulk structure.
The optimised geometrical parameters and the associated relative energies of the four-bilayer slab are given in Table 5.8. In addition, the energy of the total planar geometry (inner and outer layers) was calculated for comparison with results presented in the former section.
|
Parameter |
Value |
|
(001) Zn layer |
-0.28 Å |
|
(001) O layer |
+0.30 Å |
|
|
+0.17 Å |
|
|
-0.25 Å |
|
Energy |
6.36 ´ 10-2 Hartree |
Table 5.8: Structural parameters for the relaxed surface structure and relative energy compared with the total planar geometry. Minus sign indicates inward relaxation and 0.3 Å is the displacement corresponding to the planar structure.
Figure 5.43: Structure of the four-bilayer slab. The big spheres represent Zn and the small sphere O.
The calculated energy of the structure with relaxed surfaces
but with the inner two bilayers set to the bulk geometry is higher than that of
the totally planar structure, indicating that the relaxation of the surfaces
will involve not only reconstruction of the surface layers, but also relaxation
of layers deeper in the bulk. Next to
that, geometry in which the structure of the two inner bilayers was set to the
bulk structure shows a high degree of surface relaxation. This relaxation is more pronounced on the
(001) zinc terminated surface than the ![]() oxygen teminated
surface. Consistent with this, DFT
optimisation of a seven bilayer slab, reported in reference 33, without bulk relaxation, yielded values for the
interlayer spacing of 0.14 Å for the Zn terminated (001) outer bilayer and 0.25
Å for the O terminated
oxygen teminated
surface. Consistent with this, DFT
optimisation of a seven bilayer slab, reported in reference 33, without bulk relaxation, yielded values for the
interlayer spacing of 0.14 Å for the Zn terminated (001) outer bilayer and 0.25
Å for the O terminated ![]() outer bilayer. The results from the present relaxation
studies cannot be compared easily with those obtained for relaxation of the
two-bilayer slab. The four-bilayer slab
has an inherent bulk dipole moment which is absent in the planar two-bilayer
calculation. This bulk dipole moment
induces a smaller geometrical relaxation of the surface bilayers and the
positions of these bilayers are thus closer to the bulk values.
outer bilayer. The results from the present relaxation
studies cannot be compared easily with those obtained for relaxation of the
two-bilayer slab. The four-bilayer slab
has an inherent bulk dipole moment which is absent in the planar two-bilayer
calculation. This bulk dipole moment
induces a smaller geometrical relaxation of the surface bilayers and the
positions of these bilayers are thus closer to the bulk values.
Figure 5.44 addresses the question whether the surface relaxation is governed solely by the dipole moment. Clearly the calculated energy minimum is not the structure with lowest dipole moment, indicating that the energy of this system is not governed just by the dipole moment.
Figure 5.44: Energy versus dipole moment for the four bilayer slab.
Again the calculated dipole moment can be plotted against the theoretical dipole moment associated with the unrelaxed wavefunction. The results are given in Figure 5.45. The correlation indicates that the charge transfer reduces the total dipole moment in the lattice by ~70 %, which is much higher than in the two-bilayer case, and indicates that introducing an intervening bulk structure enhances the stability of the dipolar solution. Charge transfer between the surfaces, and change in covalency, is only a minor effect in this system as can be deduced from Figure 5.45(b) and (c).
Figure 5.45: (a) Dipole moment of the relaxed wavefunction, (b) charge transfer and (c) covalency plotted against the dipole moment associated with the unrelaxed wavefunction.
The calculations on the two- and four-bilayer slabs indicate
that surface relaxation in the dipolar ZnO surface occurs towards a less polar
surface than a bulk terminated surface.
The calculated minimal energy surface in the case of the two-bilayer
slab is nevertheless not the non-polar, planar surface. Comparing the energies of the unrelaxed
four-bilayer slab with the totally planar one indicates that relaxation of the
(001)/![]() surfaces will relax not only the outer surface layers but
will also stretch deeper in the bulk. A
second possible surface relaxation route is reconstruction. In the next section, we therefore consider a
2 ´
2 reconstruction.
surfaces will relax not only the outer surface layers but
will also stretch deeper in the bulk. A
second possible surface relaxation route is reconstruction. In the next section, we therefore consider a
2 ´
2 reconstruction.
5.5.3.3. 2 ´ 2 reconstruction
A 2 ´ 2 reconstruction is another route for reducing the dipole moment. We have considered the reconstruction involving creation of a defective surface by removing ¼ of the oxygen and the zinc atoms from the outer layer. As shown in Chapter 3, this reconstructed surface should have an overall dipole moment of ~0 Debye. Only the structure with the bulk geometrical parameters was investigated, without any structural relaxation. The slab thickness was chosen to be 8 bilayers and the calculation was performed at the HF level of theory. A representation of the structure is given in Figure 5.46, and shows a structure with holes in the surface layer.
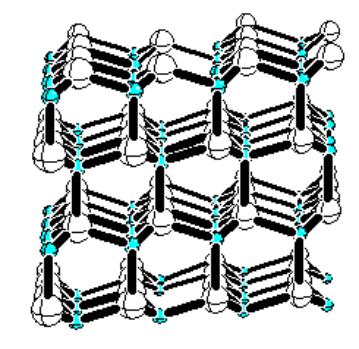
Figure 5.46: Structure of a reconstructed geometry, with bulk geometrical parameters and 2 ´ 2 surface reconstruction as described in the text.
The charges on the atoms, calculated via a Mulliken population analysis, are given in Table 5.9. The charges on the zinc and oxygen atoms in the first two layers of the defective zinc surface are also given in the table as O1 and Zn1. The charges on the zinc and oxygen atoms on the defective oxygen surface are given as O2 and Zn2. The charge transfer between the zinc and oxygen terminated surface was calculated as –0.05 e (zinc surface more negatively charged than oxygen surface) and the dipole moment equates 1.45 e.Å. Compared with the values (0.5 to 0.9 e.Å) for the dipole moment of the unreconstructed four-bilayer slab this value is slightly higher although this might be attributable to the difference in level of theory (the calculations for the four-bilayer slab are at DFT level of theory). Interestingly, the theoretical value of the dipole moment for this amount of bilayers with the unreconstructed surfaces and the charges taken as the bulk charges equates 15.5 e.Å. This shows that the surface relaxation via reconstruction is definitely a viable route for diminishing the dipole moment.
|
|
O |
Zn |
|
Average |
-1.57 |
1.58 |
|
O1 / Zn1 |
-1.45 |
1.41 |
|
O2 / Zn2 |
-1.42 |
1.44 |
Table 5.9: Values of the atomic charge (in units of e) obtained from the Mulliken population analysis for the calculations on the defective surface. 1 represents the Zn terminated surface and 2 stands for the oxygen-terminated surface.
It has to be noted that the number of layers included in the calculation is still quite small and that, for a more valid analysis, the number of layers considered should be increased. Calculations should be performed also at the DFT level of theory, given the importance of electron correlation in the structures described previously.
5.5.4. Effect of bulk doping: Aluminium and Gallium
The effect of doping was investigated by replacing a Zn atom in in a 2 ´ 2 ´ 1 supercell by an Aluminium or Gallium atom. These limited dimensions were chosen because of computational restrictions. The structure of the supercell is given in Figure 5.46 and the atom labels are used in the further discussion.
Figure 5.46: Structure of the supercell for the particular case of Al doping of ZnO.
The calculations were performed only at the HF level of theory, assuming a uniform background electron density to cancel the charge induced in the lattice. The dimensions of the unit cell were set to the Hartree-Fock optimised values, and the positions of the dopant neighbouring oxygen atoms were optimised. The neighbouring oxygen atoms were divided into two groups during this optimisation, reflecting the symmetry of the system. The neighbouring oxygen atom with the bond along the c-axis was treated independently from the three other oxygen atoms (see Figure 5.46). The geometry optimisation yielded the result that the oxygen atoms were drawn closer to the aluminium or gallium atom as shown in Table 5.9.
|
|
O10 |
O13,O14,O16 |
Energy difference (Hartree) |
|
Al |
0.25 |
0.20 |
-5.96 ´ 10-2 |
|
Ga |
0.15 |
0.10 |
-2.61 ´ 10-2 |
Table 5.9: Displacement of the oxygen atoms from their bulk values (as shown in Figure 5.46) in Å and the energy difference between the relaxed and unrelaxed geometries.
The contraction of the bond lengths to the oxygen atoms around aluminium is substantially higher than to the oxygen atoms around gallium, reflecting the relative sizes of the dopant atoms. The energy difference upon contraction is twice as high for aluminium as for gallium. The Mulliken charges have also been calculated from the electron density. Their values are summarised in Table 5.10.
|
|
Al:ZnO |
Ga:ZnO |
|
Al /Ga |
2.17 |
1.74 |
|
Zn |
1.61 |
1.61 |
|
O (nb) |
1.45 |
1.56 |
|
O |
1.56 |
1.55 |
Table 5.10: Mulliken charges for the different atoms, in e. O(nb) stands for the average value on the neighbouring atoms, while the average charge on non-neighbouring atoms is presented in O.
The Mulliken charge for the gallium atom is much lower than that for the aluminium atom, providing evidence for a much more ionic bond to O in the case of Al compared to Ga. In the case of Al, the charges on the neighbouring oxygen atoms are also affected, while in the case of gallium the neighbouring oxygen atoms have the bulk Mulliken charge.
5.5.5. Conclusion regarding the ZnO doping from the ab initio calculations
The effects of bulk doping have been considered theoretically, and Al and Ga doping has been compared. The neighbouring oxygen atoms around the aluminium dopant show larger relaxations than in the case of gallium doping: these observations correlate with a higher energy difference between the relaxed and unrelaxed structure. In addition, the aluminium-oxygen bonds show higher ionicity than the gallium-oxygen bonds. The high relaxation of the bulk structure associated with aluminium doping might indicate that the dopant prefers to be situated on the surface, although more detailed modelling of the effect of dopant atoms on the surface structure would be necessary to prove this point. High concentrations of Al dopant would be predicted to disrupt the crystal structure, consistent with the XRD spectra.
5.6. General Conclusion
In this chapter we have tried to present a coherent and general overview of the pulsed laser ablation and deposition of ZnO and the structure of the deposited films. Interesting aspects of both the behaviour of the ablation plume and the characteristics of the resulting film have been highlighted.
The ablation plume has an inherent multicomponent behaviour. The velocity of at least one part of the plume, correlated with Zn+ ions, exhibits an accelerating behaviour. We suggest that these zinc ions are created from a surface layer of molten metallic zinc.
The properties of the deposited films are highly dependent on the deposition conditions. Good quality films are deposited on substrates maintained at high ambient temperatures (400 °C) and in the presence of a low pressure (10 mTorr) of O2 background gas. The films can be doped with gallium and aluminium, but the aluminium doped films deposited even under these optimal conditions show considerable disorder indicating that aluminium disrupts the lattice. The optical band gap appears to be little affected by the doping.
Theoretical calculations highlights the importance of
surface relaxation for these films, since unrelaxed (001)/ ![]() surfaces are
inherently unstable. A first approach
to a valid ab initio description of
this surface is reported.
surfaces are
inherently unstable. A first approach
to a valid ab initio description of
this surface is reported.