6. Optical Emission Spectroscopy and imaging of ablation plumes following ultraviolet KrF nanosecond, picosecond and femtosecond excitation of graphite in vacuum.
6.1. Introduction
The nanosecond KrF laser ablation of graphite is a well-studied subject; as in ArF laser ablation the process is mainly used for production of thin films of Diamond like Carbon (DLC)[1] and Carbon Nitride (CN) films.[2] The characteristics of the deposited films are crucially dependent on the properties of the ablation plume i.e. the degree of ionisation and the velocity of the species contained within the plume. Because of this, the plume characteristics have been extensively studied by means of Mass spectrometry [3], Optical Emission Spectroscopy [4]-[6], Ion probe measurements [7]-[10] and Intensified Charge Coupled Device (i-CCD) camera imaging 1,[11].
The subject of pico- and femtosecond KrF laser ablation, as opposed to nanosecond ablation, has received much less attention. Femtosecond laser pulses have been applied to grow Diamond-like Carbon [12] and Carbon Nitride films [13], but there is a very little information concerning the composition of the plume under these specific ablation conditions. The closest studies to compare with are the following: The work of Qian et al. 12 which provides a systematic ion probe investigation of the ablation plume following 100 fs titanium-sapphire laser irradiation. The study of Shirk et al. [14] supplies information about the properties of the irradiated spot on the target surface under 120 fs - 20 ps titanium-sapphire laser irradiation. Rode et al. [15] studied the plume properties with optical emission spectroscopy for a 60 ps Nd:YAG laser system.
This chapter presents results of a comparative study of laser ablation of graphite with nanosecond (25 ns), picosecond (5 ps) and femtosecond (450 fs) Krypton Fluoride (l = 248 nm) laser pulses. The techniques used in this study are Optical Emission Spectroscopy (OES) and i-CCD imaging of the plume. These techniques enable us to study qualitatively the degrees of ionisation in the ablation plumes and quantitatively the velocity distributions of emitting species contained within the plume.
The degree of ionisation is inferred by interpretation of emission spectra of the various ablation plumes. The spectrometer used to disperse this emission into its constituent wavelengths operates in time integrated and time gated mode within a wavelength range of 360 - 900 nm.
Time gated images of the ablation plume are obtained by i-CCD imaging. The images so obtained are either of the total UV-VIS emission, or can be species selected by viewing through various narrow band pass optical filters. Mean velocities and velocity dispersions of the ablated species are calculated from these images and compared for the three different laser pulse duration times.
The results are discussed within the framework of recent theories concerning laser ablation with these pulse durations. The discussion will emphasise differences between the ablation processes occurring over these very different time scales.
6.1.1. Picosecond and Femtosecond laser ablation
The theoretical aspects of pico- and femtosecond ablation are discussed in Chapter 3. In the case of both of the studied materials, graphite [16] and silicon [17], the solid melts in a much shorter time-scale than predicted via the two-temperature model after irradiation with short laser pulses. This can be explained by a very fast disordering of the lattice in these materials which can occur at an ionic temperature considerably lower than the melting temperature of the lattice. [18]-[20] The laser source term couples directly into the electronic distribution, promoting the electrons into highly excited states. At high fluences, a large fraction of the electrons are promoted into antibonding orbitals. The system responds to the local differences in bonding interaction by ‘melting’ without any appreciable energy transfer between the excited ions and the lattice. This process is called ‘plasma annealing’ [21] and can explain the fast transfer from the solid state into an electron-hole plasma.
6.2. Experimental
The general aspects of the experimental set-up are discussed in Chapter 2. Since this set of experiments was performed in FORTH with different experimental apparatus to that available in Bristol, we will emphasise the specific differences between the two sets of apparatus.
The output of either a nanosecond (30 ns) or femtosecond (500 fs/5 ps) KrF (l=248 nm) laser is focused onto a target in a stainless steel vacuum chamber (p = 1 ´ 10-7 Torr). The interaction area comprises a rectangular spot with a size of 1.8 mm2 (0.9 ´ 2 mm) for the nanosecond pulse and 0.22 mm2 (0.33 ´ 0.66 mm) for the femto- or picosecond pulse, each of which is incident at an angle of 45°. The actual fluences used in the study are either 6.3 J/cm2 or 10.3 J/cm2 for the nanosecond, 3.6 J/cm2 for the picosecond and 2.1 J/cm2 for the femtosecond ablation of graphite. For the femtosecond laser ablation of silicon, a fluence of 2.5 J/cm2 was used. Though the fluences used are very similar for the three laser pulse durations, the laser intensity is of course hugely different, since its magnitude depends on the pulse duration. A fluence of 5 J/cm2 corresponds to an average intensity of 1.67 ´ 108 W/cm2 for the 30 ns, 1.00 ´ 1012 W/cm2 for the 5 ps and 1.11 ´ 1013 W/cm2 for the 450 fs laser pulses, respectively.
Spectroscopic measurements of the plume emission were obtained by focusing the optical emission through a quartz fibre bundle. The fibre abuts an adjustable entrance slit (set at 30 mm) to a spectrometer equipped with either a 600 lines/mm, a 1800 lines/mm or a 2400 lines/mm user selectable holographic grating, and a time-gated i-CCD camera (iStar 720D, Andor Technology).
The i-CCD camera images were obtained by decoupling the time-gated i-CCD array from the spectrometer and focusing the optical emission onto the 1024 ´ 256 pixels diode array with a ~2:1 magnification. This yields a viewing window of ~ 8 ´ 2 cm with a spatial resolution of ~ 84 mm per pixel.
The quartz fibre bundle and the i-CCD camera are also mounted differently (as described in Chapter 2) as compared with the Bristol experiment, specifically, they are mounted to view through a side flange in the chamber instead of the top flange. Thus, the viewing column for the spectrometer and the line of sight for the i-CCD array are in the plane defined by the incoming laser light and the surface normal, as opposed to perpendicular to it.
6.3. Nanosecond laser ablation of graphite
6.3.1. Optical Emission Spectroscopy
The plume characteristics were first studied by wavelength resolved optical emission spectroscopy. A wavelength resolved spectrum of the ablation plume induced by nanosecond laser excitation (10.3 J/cm2) viewed at a distance of 5 mm from the target, along the surface normal, is given in Figure 6.1. From Figure 6.1a it is evident that the emission spectrum is dominated by the strong C+ ion emission feature at the wavelength of 426.8 nm. Other intense emission lines in the spectrum are the neutral C atom line at 658.7 nm, the C+ ion lines at 387.5, 392.2, 407.7, 589.4, 658.2, 723.6 nm and the second order peaks observed at 784.4 nm (2 ´ 392.2) and 853.6 nm (2 ´ 426.8). Confirmation that these are indeed second order lines involved monitoring through a long wavelength band pass filter that rejects light at wavelengths lower than 780 nm; these second order ‘long wavelength’ features also disappeared accordingly.
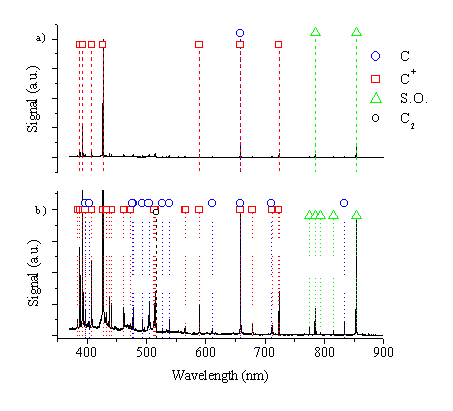
Figure 6.1: (a) Wavelength resolved emission spectrum of 248 nm nanosecond ablation of graphite, (b) a blow up of the vertical scale of (a) to see additional details.
A more detailed picture of the emission spectrum is given in Figure 6.1b. This figure confirms that all recorded optical emission lines arising from 248 nm ablation of graphite in vacuum at 10.3 J/cm2 can be attributed to either C atom or C+ ion excited species in the plume. At this distance only a very small feature attributable to C2 molecular emission can be observed (at the band head of the Dv = 0 sequence of the d3Pu-a3Pg Swan band system at ~ 516.5 nm).
As in 193 nm ablation (Chapter 4) all of the more intense emission lines of C atom and singly ionised C+ ions expected in this wavelength range are observed, illustrating that the excited species giving rise to the optical emission are produced by non-specific mechanisms during the laser ablation process. A direct excitation-de-excitation mechanism cannot explain the observed emission, given the distance of the viewing column from the ablation spot (5 mm), and the average lifetimes of the emitting states of excited C atoms and cations. As with the 193 nm ablation of graphite, the observed emissions are best explained by a cascade-down mechanism from longer-living Rydberg states.
The obtained results can be discussed in the framework of more extensive studies on the optical emission arising from 248 nm ablation and agree with the spectra obtained by Germain et al. 6-8 and Yamagata et al. 4,5. Germain et al. show that the threshold laser fluence for observation of C+ ion emission at a distance of 10 mm from the target is 8 J/cm2 and the threshold laser fluence for observation of carbon dication emission is 17 J/cm2. They also observe a small amount of C2 molecule emission close to the target at incident fluences <7 J/cm2. Yamagata et al. observed emission of neutral carbon atoms and small amounts of emission from C+ ions at a fluence of 3 J/cm2 and at a distance of 10 mm from the target when ablating both poly- and single crystalline graphite. It must be noted that the relative intensity of the observed lines is highly dependent on the experimental set-up (base vacuum, distance of viewing column from target), the definition of the fluence and the spectral efficiency of the spectrometer for example, which could explain differences between the two studies.
Both studies observe that the C2 molecular emission becomes predominant if the experiment is performed in a small pressure of nitrogen background gas. This illustrates that the excited dicarbon molecules are formed via collisional processes.
These earlier sets of studies investigate the ablation plume with optical emission spectroscopy, which only provides information on the radiative decaying excited species. In comparison Pappas et al. 9, studied the ablation plume following 248 nm irradiation at fluences in the range of 1-10 J/cm2 with mass spectrometry. They observed that the ablation plume contains some fraction of dicarbon molecules maximising at a fluence of 5 J/cm2 and, presumably because of increasing laser-plume interactions, declining rapidly at higher fluences.
6.3.2. i-CCD camera images
In the present study, nanosecond laser ablation of graphite has been studied with i-CCD camera imaging at two different fluences, namely 6.3 J/cm2 and 10.3 J/cm2, to obtain information on the fluence dependency of the plume characteristics.
Analysis of the optical emission spectrum shows that the emission line at ~426.8 nm is the most intense C+ ion emission and that all emission above 780 nm can be attributed to neutral C atom emission. A third region ~520 nm is the region of the brightest emission feature of the C2 molecule, the Dv = 0 transitions of the Swan band. These wavelength regions can be monitored selectively by mounting appropriate optical filters in front of the i-CCD pixel array. The filters chosen for this study are a narrow band interference filter with a central wavelength of 427 nm to transmit just the emission of the intense C+ ion line, a long wavelength band pass filter that cuts off light of wavelengths below 780 nm to select emission features associated with the neutral carbon atom and a filter that selects light of a wavelength of 520 ± 20 nm to allow selective observation of electronically excited C2 molecules. The transmission of the filters is given in Figure 6.2 superimposed on the emission spectrum shown in Figure 6.1.
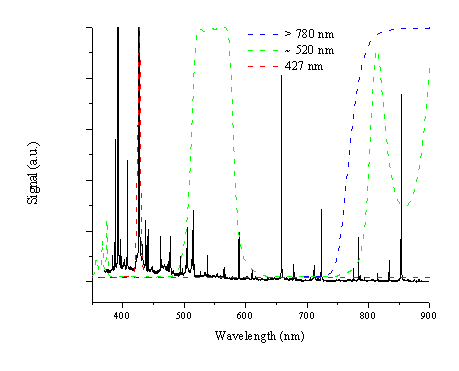
Figure 6.2: Transmission curves for the three filters used in the i-CCD camera studies superimposed on the emission spectrum arising from 248 nm nanosecond ablation of graphite in vacuum.
Figure 6.3 compares i-CCD camera images of (a) the total emission of the plume with the emission obtained by positioning the 520 nm, the >780 nm and the 427 nm transmission filters in front of the i-CCD camera (b)-(d) respectively. Application of these filters shows that the total emission can be divided into three components: one, fast, component related with the C+ ion emission, one slower component due to neutral carbon atom emission and one component just in front of the target associated with C2 molecule emission. The dicarbon molecule emission is only observable close to the target (< 5mm), thus explaining why the optical emission spectrum recorded at a distance of 5 mm from the target surface does not show an intense C2 molecule emission feature.
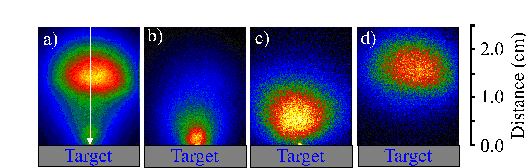
Figure 6.3: Selected i-CCD camera shots observed with a time gate of 20 ns and a delay of 380 ns. (a) shows the total emission, (b), (c) and (d) show the emission arising from C2, C, and C+, respectively. The arrow indicates the direction incident of the laser beam (the laser beam is incident at 45° but its projection on the recorded images is 0°).
The i-CCD camera images are symmetric around the surface normal. This enables us to analyse the images by taking slices through the images parallel (defined as the y-axis) and perpendicular (defined as the x-axis) to the surface normal to obtain plots of signal versus distance from the target at a given time after the laser irradiation. Figure 6.4 shows the total emission of the ablation plume at a time delay of 380 nanoseconds after the ablating laser pulse together with a deconvolution of the total signal viewed along the surface normal (x-direction) into its respective components. The deconvolution shows that the total emission can be attributed into emissions from C atoms, cations or dicarbon molecules. The relative intensity of the C+ ion emission at an incident fluence of 10.3 J/cm2 is far more dominant than that observed at 6.3 J/cm2, implying that the ionisation fraction of the plume scales with increasing fluence.
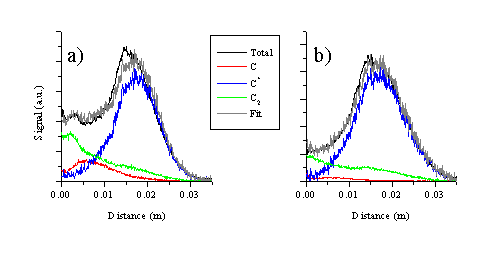
Figure 6.4: Cuts through the central part of the i-CCD image of the plume along the surface normal with a time delay of 380 ns for the two fluences studied: (a) 6.3 and (b) 10.3 J/cm2. The signal associated with the different components is fitted to the total signal.
The obtained signal versus
distance plots show a single peaked behaviour for the C atom and cation
distributions. This enables us to
define a mean velocity and velocity dispersion for each of these
components. A mean distance from the
target at any given delay time can be inferred from the relevant i-CCD image by
integrating a set of signal slices along the surface normal and finding the
distance (![]() ) where the integrated distribution reaches half of the total
integrated signal. This procedure
reduces the sensitivity to noise, which is inevitably present in the
experimental results.
) where the integrated distribution reaches half of the total
integrated signal. This procedure
reduces the sensitivity to noise, which is inevitably present in the
experimental results.
A further elaboration involves
defining the points where 25% and 75% of the signal is reached as the Half
Width at Half Maxima for the rising (towards vacuum) and the trailing (towards
target) edge. The sum of the thus
obtained Half Width at Half Maxima provides an experimental definition of the
Full Width at Half Maximum and the difference between both gives an idea of the
asymmetry of the distributions.
Perpendicular slices (x-direction) through the images are also obtained
at distances close to ![]() in order to define
the dispersion along an axis orthogonal to the surface normal (x-direction) of
each emitting component within the plume.
These latter distributions are highly centro-symmetric and can easily be
fitted by a normal Gaussian distribution, which again serves to remove the
noise from the experimental data.
in order to define
the dispersion along an axis orthogonal to the surface normal (x-direction) of
each emitting component within the plume.
These latter distributions are highly centro-symmetric and can easily be
fitted by a normal Gaussian distribution, which again serves to remove the
noise from the experimental data.
The i-CCD images obtained by monitoring the emission through the filter centred ~ 520 nm have to be processed more carefully. The C2 molecule emission distribution obtained in these images is contaminated by signal from C atom and cation lines lying in the active region of the optical filter. These images are deconvoluted by subtraction of the C+ ion and atom emission from the obtained signal to obtain the distribution of the C2 emission. To obtain a functional form for the emitting C atom and cation distributions their experimental distributions have been fitted to a split Gaussian with an independent Half Width at Half Maximum for the trailing and rising edges. This type of function was chosen for its large flexiblity; as Figure 6.5 shows the function mimics the observed distributions closely. The fitted functions are used to subtract the signal associated with the C atom and cation emission from the 520 nm images. Although there is no unique scheme for subtracting the signals, the data shown in Figure 6.5 indicate that an excited dicarbon molecule distribution remains just in front of the target even at late time-scales. Since the subtraction scheme is somewhat arbitrary we do not report any velocities for the dicarbon molecule.
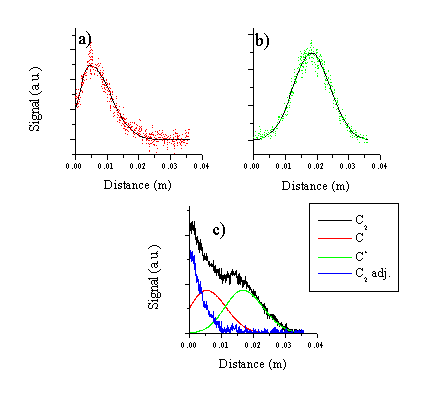
Figure 6.5: Cuts along the surface normal through (a) the C atom and (b) C+ ion images, together with the fitting functions used for these respective species and (c) deconvolution of the 520 nm signal to yield an emitting C2 molecule distribution.
With this
deconvoluted signal attributable to the emitting C2 molecules and
the fitted distributions for the C atoms and cations, we can build a model of
the structure of the emitting species in the plasma along the surface
normal. The model distribution is given
in Figure
6.6. From this
model we can infer that both the cation and atom distribution have developed a
non-zero Centre of Mass velocity distribution.
Such density distributions are observed for an adiabatically expanding
gas after formation of a Knudsen layer [22]. The C2 molecule distribution
peaks at the target surface and declines monotonically into the vacuum. This model also shows that the trailing edge
(towards the target) of the C atom distribution has a finite (~ 60% of the peak
signal) density at the target surface.
Since this model distribution is derived from slices along the surface
normal this estimate is an overestimation, the signal has to scaled by the
distance from the target surface to get a more exact estimate of the radial
variation of the density.
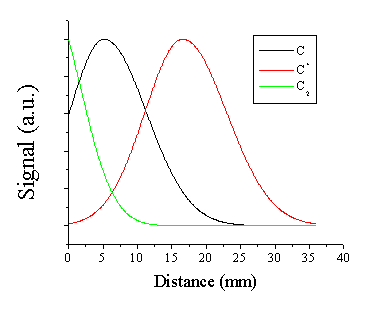
Figure 6.6: Model distribution of the ablation plume from graphite at an incident fluence of 10.3 J/cm2 and a delay time of 380 ns.
Plots of mean distance versus delay time are shown in Figure 6.7 for both fluences studied. These show the mean distance scaling linearly with time. The line fitted to the experimental points intercepts the origin of the plot within the experimental error, confirming that the onset of ablation occurs at time equals zero. The gradient of this linear relationship corresponds to the mean velocity of the particles. The dispersion of the velocities is indicated by the FWHM of the curves. The calculated velocity dispersion perpendicular to the surface normal is also given in Figure 6.7.
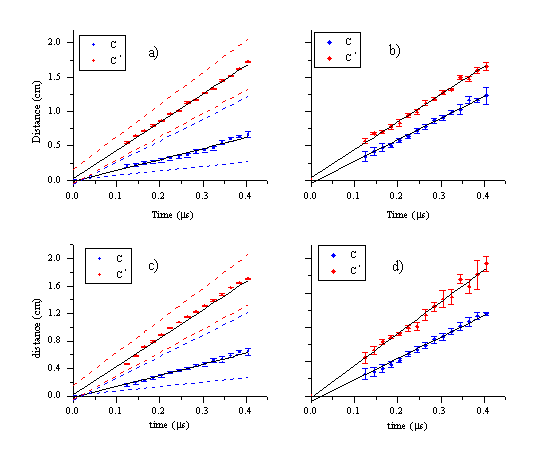
Figure 6.7: Experimental results for a fluence of (a,b) 6.3 J/cm2 and (c,d) 10.3 J/cm2 (a) and (c) show the centre of mass velocities for the C atoms and cations with their respective FWHM’s indicated by the dashed lines. (b) and (d) show the FWHM’s perpendicular to the surface normal for both fluences.
The deduced velocities are given in Table 6.1. Comparing the two fluences one can conclude that the velocities of the C atom and cation signals increase slightly with the fluence. The velocity of the emitting C atoms is less than half that of the emitting C+ ions. The velocity dispersion of the C+ ion signal increases with increasing fluence whereas that for the C atom distribution decreases. Overall, the velocity distributions are overall relatively insensitive to the difference in applied laser fluence.
|
|
|
|
6.3 J/cm2 |
10.3 J/cm2 |
|
Mean (km/s) |
C* |
|
16.0 ± 0.4 |
16.8 ± 0.9 |
|
C+* |
|
41.2 ± 0.5 |
43.3 ± 0.3 |
|
|
|
|
|
|
|
|
FWHM (km/s) |
C* |
Rising edge |
15.5 ± 0.4 |
8.8 ± 0.8 |
|
|
Trailing
edge |
9.5 ± 0.1 |
8.4 ± 2.0 |
|
|
|
Perpendicular |
31.5 ± 2.4 |
31.3 ± 2.0 |
|
|
|
|
|
|
|
|
C+* |
Rising edge |
5.8 ± 0.5 |
7.2 ± 0.8 |
|
|
|
Trailing
edge |
7.2 ± 0.3 |
8.1 ± 0.3 |
|
|
|
Perpendicular |
40.3 ± 3.0 |
46.4 ± 6.8 |
Table 6.1: Calculated velocities and velocity dispersions for emitting C atoms and cations.
The results of this nanosecond
ablation study should be compared with those reported in references 11 and 1. In these earlier studies the ablation plume arising
from KrF ablation of graphite at fluences of 6.7 and 17.7 J/cm2 were
similarly studied by wavelength selected i-CCD camera imaging and photon
counting spectroscopy. As in the
present study the plume emission could be subdivided into three main
components, each with a distinct mean velocity. When ablating with a fluence of 6.7 J/cm2, the total
signal could be deconvoluted into a fast component consisting of C+
ion emission (![]() = 35 km/s), a component consisting of neutral C atom emission
(
= 35 km/s), a component consisting of neutral C atom emission
(![]() = 11 km/s) and a slow component attributable to C2
molecule emission (
= 11 km/s) and a slow component attributable to C2
molecule emission (![]() = 3 km/s). A fourth
component was evident at higher ablation fluences (17.7 J/cm2) and
was described in terms of jets of excited C2 molecule emission
arising from hydrodynamical instabilities.
The present results agree not just qualitatively but also quantitatively
with the earlier findings, illustrating the high degree of reproducibility
possible with these experiments.
= 3 km/s). A fourth
component was evident at higher ablation fluences (17.7 J/cm2) and
was described in terms of jets of excited C2 molecule emission
arising from hydrodynamical instabilities.
The present results agree not just qualitatively but also quantitatively
with the earlier findings, illustrating the high degree of reproducibility
possible with these experiments.
6.3.3. Results and Discussion
Optical emission accompanying nanosecond laser ablation is very long lived relative to the average radiative lifetimes of the excited levels that give rise to the observed emission lines as indicated previously in this chapter and in Chapter 3. This observation holds for ablation of all materials studied in this thesis, indicating that there must be some general mechanism for explaining this behaviour. The rationale given for this behaviour is that observed emission arises at the end of a slow ‘cascade down’ mechanism as shown in Figure 6.8. The cations generated via the ablation event can recombine via third-body recombination with an electron, given a high enough plume density. The product of such recombinations are likely to be in Rydberg states with high principal quantum number, n, since such recombinations involve the least energy transfer to the third body. Many of these Rydberg states will not only possess a high principal quantum number but also a high angular momentum quantum number, ∆l. Many of these highly excited states are very long lived, since their radiative decay is restricted by the selection rule l = ±1 [23]. Such mechanisms will lead to a slow cascade down mechanism, which can account for the apparent delayed emission by the observed species in the plume.
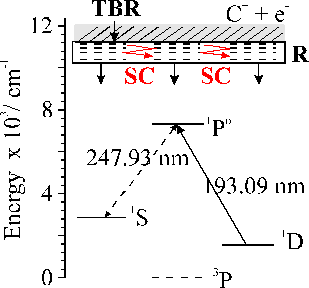
Figure 6.8: Simplified Grotrian diagram for atomic carbon. TBR represents the three body recombination, which leaves the products in highly excited Rydberg (R) states. These Rydberg states are presumed to decay by a slow radiative (SC) cascade down, including the observed transitions, en route to the ground state.
Another general process in nanosecond ablation, as pointed out previously, 23 is interaction between the incident laser light and the produced plasma. The interaction between the plasma and the plume is governed by inverse Bremsstrahlung and multiphoton ionisation. Inverse Bremsstrahlung is less important for shorter wavelengths as discussed previously in the 193 nm work. Multiphoton ionisation on the other hand is relatively unlikely for carbon atoms in the ground state, since its high ionisation potential (11.26 eV), means that three KrF photons are required for this process. Pappas et al. 9 pointed out in their study on KrF laser ablation that there is a resonance between the C atom 2p13s1 (1P1o) ¬ 2p2(1S0) transition (247.93 nm) and the KrF laser wavelength. If the 1S0 level is populated a resonantly enhanced two photon ionisation should occur since the energy of the transition lies within the spectral lineshape of the laser transition. The KrF laser intensity at 247.93 nm is estimated to be only ~ 15 % of the peak intensity, while the C(1P1o-1D2) transition overlaps much closer with the peak of the ArF lasing transition (at ~ 90% of the peak intensity), causing a higher ionisation fraction in the case of ArF laser produced plumes (as depicted in Figure 6.8).
The particle ejection behaviour of graphite under nanosecond 248 nm laser irradiation was also investigated in the mass spectrometric study of Krajnovich 3 at laser irradiation fluences just above the ablation threshold (0.3-0.7 J/cm2). Cn clusters with n ≤ 5 are observed in this study but the dominant products are carbon atoms, dicarbon and tricarbon molecules. The relative yields of the C:C2:C3 fractions were estimated as 29:18:51. Since the fluences are just above the ablation threshold this study provides perhaps the clearest picture of the fundamental ejection mechanisms of graphite under 248 nm irradiation. At higher laser photon flux many of the molecular products will break down to form C atoms. This is supported by the aforementioned observations of Pappas et al. 9, which show an increasing C2 molecule yield up to 5 J/cm2. Above this fluence the relative yield of the C2 molecule species declines sharply, consistent with dissociation of the dicarbon molecules induced by the laser photons.
The ejection and laser excitation behaviour can also explain the structure of the plume at the studied fluences, namely a fast C+ ion emission signal, followed by a slower C atom distribution. This is compatible with the laser-induced dissociation of the ablated products followed by laser-induced ionisation of the product C atoms in the plume. The front edge of the ablation plume is preferentially excited by the laser light. The temperature rises in the interaction region and causes a pressure rise, which accelerates the heated zone to a higher terminal velocity.
C2 emission is observed at a fluence of 10.3 J/cm2 although, as suggested above, most of the directly ejected C2 molecules are dissociated by the laser photon flux. This implies a different creation mechanism for the observed excited C2 molecules compared with the ground state C2 molecules. Geohegan et al. 1 showed via photon counting spectroscopy that the C2 emission region also contains emission from higher carbon clusters and even black body radiation from small graphite particles. This indicates that the excited, radiatively decaying, C2 molecules are formed in a collisional regime just in front of the target. As shown in Figure 6.6, a significant fraction of the C atom distribution is remaining at the target surface. This fraction encounters, and collides, with the forward flow of particles evaporating from the target during the laser irradiation. The collisions in this high-pressure region can produce the higher mass carbon fragments observed or more likely even larger Cn fragments undergo collisional dissociation to produce the C2 fragments.
6.4. Picosecond and Femtosecond laser ablation of graphite
6.4.1. Optical Emission Spectroscopy
Figure 6.9 shows the wavelength resolved optical emission spectrum from a graphite target after picosecond radiation (5ps - 3.6 J/cm2) at three different distances, at 0.5 mm, 1 mm and 5 mm from the target. As in the case of nanosecond ablation the spectra are governed by the strong emission feature of the C+ ion at 426.8 nm. Other strong emission features are: the C+ ion lines at 392.1, 589.2, and 658.3 nm and the carbon dication lines at 406.8, 418.7, 465.1 and 466.6 nm. The corresponding emission spectra observed following femtosecond irradiation (450 fs - 2.1 J/cm2) of graphite are given in Figure 6.10. Comparing this with Figure 6.9, we observe that the emission behaviours arising in the two different regimes are very similar, but noticeably different from the emission observed in the case of nanosecond ablation of graphite.
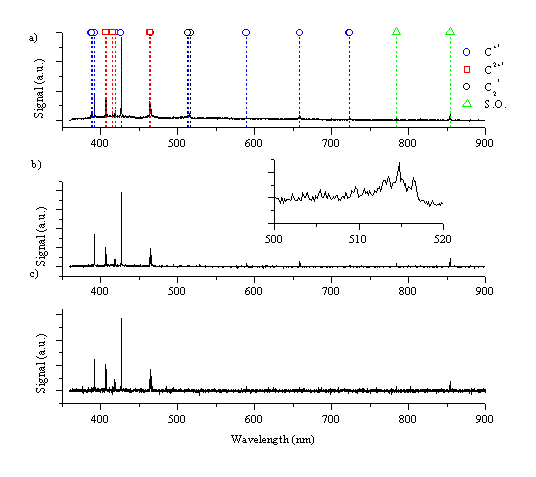
Figure 6.9: Optical emission following picosecond laser ablation of graphite in vacuum monitored at (a) 0.5 mm, (b) 1 mm and (c) 5 mm from the target. The inset shows the spectrum around 520 nm in expanded detail.
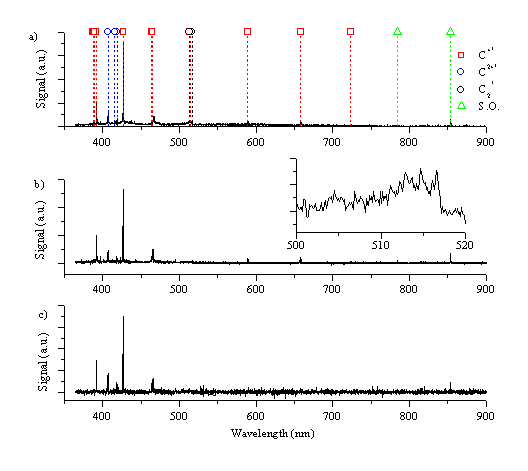
Figure 6.10: Optical emission following femtosecond ablation of graphite in vacuum monitored at (a) 0.5 mm, (b) 1 mm and (c) 5 mm from the target. The inset shows the spectrum around 520 nm in expanded detail.
Neither of the spectra exhibit any emission features associated with excited C atoms, and the total emission intensity is much less than in the nanosecond case. This is also evident by the bare eye; the emission plume is almost indiscernible except for the spot of the laser footprint on the target. This can be compared with the removal rate for the different laser pulse lengths; for the nanosecond laser ablation the removal rate is 500 nm/shot, at a laser fluence of 6.3 J/cm2, while for femtosecond laser ablation it is only ~ 140 nm/shot, at a laser fluence of 2.1 J/cm2, as measured by stylus profilometry. It has to be noted that the spot size of the nanosecond laser on the target (1.8 mm2) is much larger than the femtosecond laser (0.22 mm2) giving a much higher removal rate for the nanosecond ablation compared with femtosecond ablation.
The spectrum taken just in front of the target (0.5 mm) contains a small amount of molecular C2 emission, as shown in the insets to Figure 6.9 and Figure 6.10, evident from the rise in signal at ~516 nm, associated with the Dv = 0 progression in the Swan band system. A second observable feature in spectra taken very close to the target is a broad band emission in the range of 360 - 450 nm (observable in Figure 6.11a). This might be attributable to hot electrons in the plume emitting photons at wavelengths predicted by the Bremsstrahlung equation, or broad band emission of tricarbon radicals. In addition the line spectrum is superimposed on a continuum emission arising from black body radiation of large particles. Spectra recorded at 3 and 5 mm do not exhibit any of these broad emission features, demonstrating that they are confined to the high-pressure region just in front of the target. The spectra taken at longer distances show a radiative decay analogous to that observed in the nanosecond laser ablation experiments.
The optical emission close to the target has also been
studied in time gated mode, with a long time delay (0.1 ms) between the laser
ablation event and the start of the time gate on the i-CCD. Given such a time delay, it was expected
that the fast plasma plume should have propagated far beyond the viewing
column; the i-CCD camera images confirm this expectation. The displayed spectrum is corrected for the
wavelength dependent reflectivity of the grating and the quantum efficiency of
the i-CCD array by multiplying the signal by a wavelength dependent function,
which was derived from the relevant efficiency curves provided by the
manufacturers. This corrected spectrum is given in Figure 6.11b, and shows weak molecular emission due to C2
molecules (Dv
=
-1, 0 and 1 Swan band transitions) superimposed on the black body radiation
from larger particles. The 360-450 nm
emission feature has disappeared, suggesting that this feature is associated
with fast electrons in the plume rather than slow moving Cn
radicals. The wavelength dependence of
the black body radiation curve is reproduced well assuming a temperature of
3050 ±150
K. Very similar temperatures can be
derived by fitting the black body radiation background signal underlying the
structured spectra recorded at early times for both picosecond and femtosecond
laser irradiation regimes.
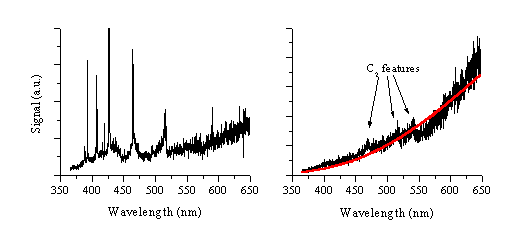
Figure 6.11: Emission spectra corrected for the wavelength dependent quantum efficiency of the grating and the i-CCD array, recorded at (a) early and (b) late time-scales following 248 nm ablation of graphite in vacuum using 450 fs laser pulses.
These optical emission results can be compared with those reported by Rode et al. 15 in their 1064 nm high repetition rate (76 MHz) 60 ps laser ablation studies of graphite in vacuum using fluences of 0.17 J/cm2 (corresponding intensity = 2.8 ´109 W/cm2). This is, to the best of our knowledge, the only comparable study reporting optical emission following short pulse duration laser ablation of graphite. Their emission spectrum shows carbon cation and dication emission, weak radiation from one neutral C atom line at 248 nm and no emission from C2. This might be due to the position of their viewing column relative to the target, which is not indicated in the study. They infer a rough estimate of the plasma temperature, between 1.5 and 6 eV. In addition, the temperature of the target and of particulates in the plume is calculated from fitting the spectrum of the accompanying black body radiation, yielding values between 2500-3500 K. These observations and values are remarkably similar to those obtained in this study, with the differences likely attributable to differences in experimental set-up. This suggests that the optical emission following laser ablation of graphite in vacuum with laser pulse duration < 100 ps is broadly similar, and independent of the precise time duration or the laser wavelength.
6.4.2. i-CCD camera images
As in the nanosecond studies, the total emission observed by time-gated i-CCD imaging can be deconvoluted by the application of filters, as demonstrated in Figure 6.12 for the cases of both picosecond and femtosecond laser excitation. The plume mainly consists of emission originating from the carbon cation and the dicarbon molecule. As demonstrated in the wavelength dispersed optical emission spectra there is no noticeable emission from neutral carbon atoms. Note that this does not necessarily imply that there is no atomic carbon in the ablation plume, since the C atoms might be ejected in non-emitting states (e.g. the ground state).
The emissions from the ablation plumes in the picosecond and femtosecond ablation experiments appear very similar. In both cases the characteristics of the emitting species are comparable with the behaviour observed under nanosecond laser ablation excitation, except for the absence of the neutral atomic carbon component. The C+ emission appears as a fast distribution, while the C2 molecule emission is confined to a small volume just in front of the target surface. This suggests similar excitation mechanisms in the case of all three pulse durations.
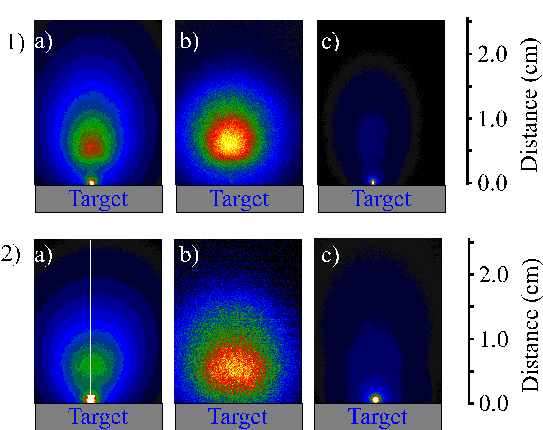
Figure 6.12: i-CCD camera images of the emission plume recorded with 20 ns time gate starting 120 nanoseconds after laser irradiation of the graphite target. 1) picosecond radiation and 2) femtosecond radiation, a) Total signal, b) emitting C+ signal and c) emitting C2 molecule signal.
The total emission can again be deconvoluted into its respective parts, as shown for both pulse durations in Figure 6.13. The total signal is fitted reasonably well in terms of just these two distributions, though the fit for the picosecond ablation fails to include the whole signal, and the fast edge (towards the vacuum) of the total signal is more pronounced than the rising edge of just the fast C+ species. One possible source of extra signal could be emitting C2+ ions travelling faster than the C+ ions, but this remains a hypothesis since we did not experimentally measure the velocity distribution of the C2+ ions. We also note that this fast component is not observed on the total signal image recorded with femtosecond excitation, indicating that it might be an experimental artefact.
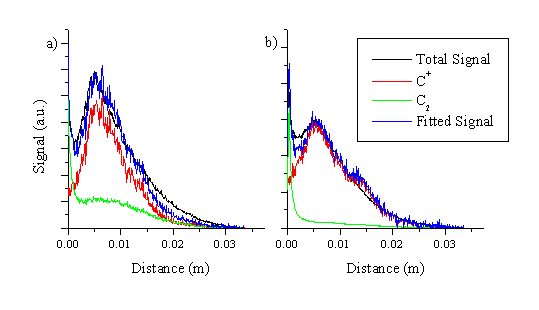
Figure 6.13: Deconvolution of the total signal image along the surface normal at 120 nanoseconds after laser irradiation and with a time gate of 20 ns for (a) picosecond and (b) femtosecond laser ablation.
The data reveal a slow component to the total emission close to the surface due to C2 emission and a fast signal that can be assigned to emission of C+ ions. The velocity of the C+ ions is calculated in the same way as for the nanosecond images. The mean velocity and its dispersion are illustrated in Figure 6.14, and compared with those obtained in the nanosecond ablation experiments in Table 6.2.
As in the nanosecond laser studies, the distributions recorded with the ~ 520 nm filter contain signal from electronically excited C+ ions and C2 molecules. The spectrum is deconvoluted by subtracting an approximately weighted C+ component from the total image. As with the nanosecond ablation of graphite, we do not attempt to infer any velocity for the resulting C2* distribution.
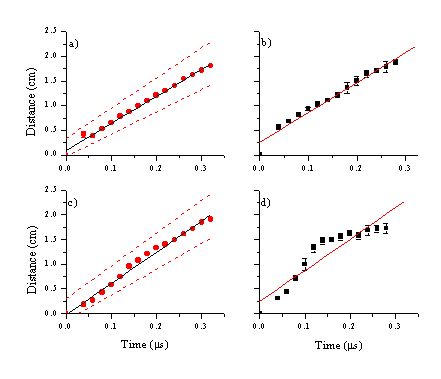
Figure 6.14: Mean distance versus time plots for picosecond (a,b) and femtosecond (c,d) laser ablation. (a) and (c) are the centre of mass velocities for the C+ ions with their FWHM’s indicated as dashed lines. (b) and (d) are the distance FWHM’s perpendicular to the surface normal for both pulse durations, measured at the mean of the distribution along the surface normal.
|
|
Velocity (km/s) |
FWHM (km/s) (y-direction) |
FWHM (km/s) (x-direction) |
|
Nanosecond |
41.2 ± 0.5 |
12.9 ± 0.8 |
40.3 ± 3.0 |
|
Picosecond |
51.2 ± 1.0 |
16.0 ± 2.1 |
57.1 ± 6.2 |
|
Femtosecond |
63.2 ± 1.1 |
14.2 ± 4.1 |
63.6 ± 8.0 |
Table 6.2: Mean velocities and velocity dispersions of electronically excited C+ ions in pico- and femtosecond ablation of graphite compared with the nanosecond ablation results. The x- and y-directions are perpendicular to, and along, the surface normal, respectively.
The calculated centre of mass velocity for the emitting C+ ions increases with decreasing laser pulse duration, while the FWHM along the surface normal (y-direction) shows little dependency on the laser pulse duration. The FWHM perpendicular to the surface normal scales with the Centre of Mass velocity along the surface normal. This implies that the excited C+ ions are ejected in a constant solid angle independent on the pulse duration. The distributions are relatively narrow and forward peaked in all cases.
These figures can be compared with those presented by Qian et al. 12, although the fluences (10-600 J/cm2) and laser intensities (1 ´ 1014 – 6 ´ 1015 W/cm2) used in their study are much higher than the fluences used in the present work. Their Time of Flight ion transients show a broad distribution (see Chapter 3) with a pronounced double peak behaviour at these high fluences, these have been interpreted in terms of a thermal peak, with velocity ~ 60 km/s, and a suprathermal peak, with velocity ~ 240 km/s. A more detailed discussion of the origin of this plume splitting was given in Chapter 3.
Only the thermal component of the plume is observed in the present i-CCD camera imaging study. This correlates with the much lower fluence and laser intensity used here. As argued in reference 12, the relative intensity of the suprathermal peak is highly dependent on the fluence used. Note, however, that a suprathermal component cannot be explicitly excluded in the present ablation study, since, with i-CCD camera imaging, only emitting species are observed. It could be that higher velocities imply less opportunity for three body recombination reactions (because of the radial thinning of the plasma) and thus a lower probability of forming, and thus detecting, emitting species via this mechanism.
The distributions can again be fitted and modelled: the
model distribution is shown in Figure
6.15. Comparing
these figures with those derived from imaging the nanosecond ablation emissions
(Figure 6.6) we observe a higher plume density for the nanosecond
ablation at the target surface at a given time delay since the existence of C*
in the ablation plume following nanosecond excitation. In apparent contradiction with this
observation, however we still observe a bright spot of C2 emission
just in front of the surface which, by analogy with the nanosecond irradiation
results, we attribute to a collisional channel. Possible reaction routes by which emitting dicarbon molecules
could form from recombination of a C+ ion and a carbon atom are
given in equations (6.1), (6.2) and (6.3) where, as usual, asterisks indicate an excited state
species and TB stands for Third Body.
The reaction given in equation (6.1) is highly improbable since it is a four body
reaction, while the reaction given in equations (6.2) is also unlikely since the reaction involves a
transient ionic species, ![]() . The reaction given
in equation (6.3) is more plausible, but involves excited C atoms for
which there is no evidence in the emission spectrum.
. The reaction given
in equation (6.3) is more plausible, but involves excited C atoms for
which there is no evidence in the emission spectrum.
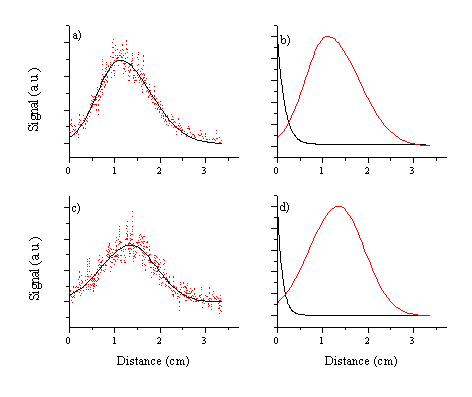
Figure 6.15: Model distribution of femto- and picosecond laser ablated plume at a time delay of 120 ns derived from taking slices through the images along the surface normal. (a) the fitting function for the C+ ion emission arising in the picosecond laser ablation of graphite compared with the experimental signal (b) the model distributions for the C+ ion and the dicarbon molecule emissions arising in the picosecond pulse laser ablation, (c) and (d) equivalent graphs for femtosecond laser ablation.
![]() (6.1)
(6.1)
![]()
![]() (6.2)
(6.2)
![]()
![]() (6.3)
(6.3)
Given the conceptual difficulties associated with each of these proposed mechanisms we suggest that the region of C2 emission is formed by one or more alternative reaction pathways involving non-emitting species. The short laser pulse duration means that it is very unlikely that the laser light will be absorbed by the ejected species. Since a large part of the total ablated material is ejected via a thermal mechanism (according to the two-temperature model) the ablation plume will consist of an abundance of ground-state species. Possible mechanisms to form electronically excited C2 are given in (6.4) and (6.5).
![]()
![]() (6.6)
(6.6)
The first mechanism (6.4) is a three body recombination of two ground state carbon atoms ejected by the target via a thermal mechanism, the second mechanism (6.5) represents dissociative (electron or atom) recombination of larger particulates and the third proposed mechanism (6.6) is reaction of a carbon species with the target surface. The existence of these large particulates has already been demonstrated via optical emission spectroscopy of the black body radiation evident at long time-scales. Their deduced temperature (~3000 K) is below the melting point of graphite (4300 K [24]). These large particulates are visible to the bare eye as bright incandescent tracks originating from the focal volume. Figure 6.16 shows tracks generated by these particulates at different delay times. The tracks indicate that the particulates have a well-directed forward velocity and that they originate from the laser interaction spot, thereby proving that the particulates are associated with the laser ablation process.
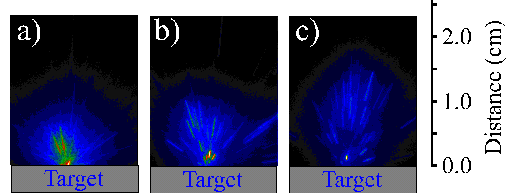
Figure 6.16: i-CCD images of large particulates observed using a time gate of 50 ms at different times, (a) 40 ms, (b) 60 ms and (c) 80 ms after the laser pulse.
A distribution for these particulates can be obtained by summing up a number of shots (typically 200 shots) viewed with a sufficiently small time gate to ensure that the particulates show up as well defined dots in the pictures instead of tracks. A selection of such images obtained at different delay times is shown in Figure 6.17. Since the summed i-CCD camera images show a continuous distribution we can treat these pictures in the same way as the optical emissions of the atomic and ionic species in the plume. The centre of mass distance versus the time can be plotted out and is given in Figure 6.18, noticeably, the obtained curves do not follow linear relationships, as opposed to the atomic/ionic emission. The angular distribution of the total signal at any given delay time was calculated by taking radial slices through the images and summing the total signal above the background level. Since all of these distributions had a very similar angular form, they were finally summed to give an average angular distribution. The average angular distributions so obtained, for both the pico- and femtosecond ablation studies, are shown in Figure 6.18 together with a plot describing the definition of the angle quoted in these distributions. Table 6.3 summarises the results.
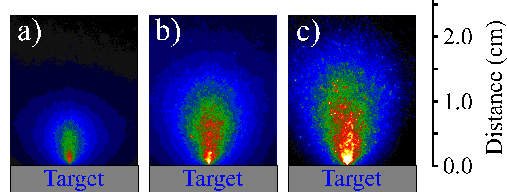
Figure 6.17: Integrated image (200 shots) of the black body radiation associated with the large particulates recorded with a gate width of 1 ms at different time delays, (a) 40 ms (b) 80 ms and (c) 130 ms for the femtosecond laser ablation of graphite in vacuum.
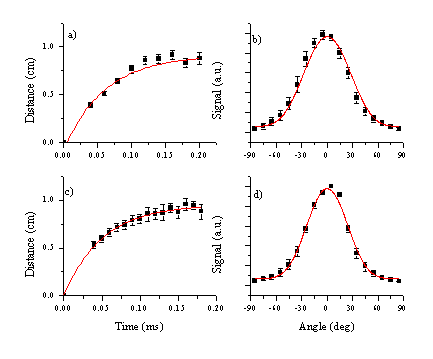
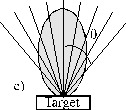
Figure 6.18: (a) Centre of mass velocity with the first order exponential decay fitting curves to the points (red lines), and (b) angular distribution for the picosecond ablation. (c), (d) corresponding graphs for femtosecond laser ablation. (e) Cartoon of the deconvolution the angular distribution.
|
|
Initial Velocity (m/s) |
Terminal Velocity (m/s) |
n |
|
Picosecond |
100 |
29.6 ± 2.3 |
4.5 |
|
Femtosecond |
160 |
23.7 ± 0.8 |
6.0 |
Table 6.3: Initial COM velocity of the particulates (calculated by the slope of the line defined by the origin and the first point) and terminal velocity (calculated by fitting the points to a line) along the surface normal and the value for the fit of the angular distribution (n) to a cosnq distribution.
The calculated terminal velocity for these particulates generated both with picosecond and femtosecond pulses is around 25 m/s and the initial velocity is calculated as 100-160 m/s. This, of course, implies that the particles decelerate during their time of flight. Important to note at this point is that the density of the particulates ejected every laser shot, as shown in Figure 6.16, is too low (~100 particulates/shot) to assume any interactions between them at later time delays. Also the plasma plume at these time delays has propagated far beyond the viewing zone, inferring that the particulates are propagating in a field free regime (without any forces applying on them). This assumption is supported by the observation that the recorded tracks in Figure 6.16 are linear without any deflections or kinks, which would imply force field gradients or collisions.
A closer look at the images in Figure 6.17 reveals that an intense region remains just in front of the surface which could be the reason for this apparent deceleration. A possible interpretation of this observation is that, since the particles are created with a certain temperature and with a given kinetic energy, the smallest particulates will exhibit the highest velocity while bigger particulates will propagate with smaller velocities. The smaller particulates will also cool down faster via black body radiation, and will become undetectable earlier in time (because of the red shift) given the wavelength dependent quantum efficiency of the CCD array. So the velocity distribution would apparently slow down at later time delays by this mechanism.
The initial velocity can be correlated with the particle
size, assuming the initial velocity distribution of the particulates is
Maxwellian, as proportional to ![]() - where T is the melting/sublimation temperature
of graphite (~4300 K) and M is the
particulate mass. The particle mass
corresponds to Cn clusters
of mean particle size, n, ~275
assuming an initial velocity of 160 m/s.
- where T is the melting/sublimation temperature
of graphite (~4300 K) and M is the
particulate mass. The particle mass
corresponds to Cn clusters
of mean particle size, n, ~275
assuming an initial velocity of 160 m/s.
The observation that the velocity distribution is highly forward peaked, as shown in Figure 6.18 and summarised in Table 6.3, implies that the particulates are ejected via a different mechanism than a thermal ejection mechanism, which would exhibit cosq behaviour. Care has to be taken of the fact that the images are a two dimensional projection of a three dimensional event in the interpretation of this observation. The squashing of a 3-D event in a 2-dimensional picture can induce a higher forward peaking of the plume because of overestimation of the density of the dense regions within the plume, in this case the region along the surface normal, although it is expected that this is not the sole reason for this forward peaking. Another contributing factor is that the particulates are ejected from a microscopically rough surface which enhances also the yield of forward directed material. Additionally, of course, we recognise that these macroparticles are ejected simultaneously with, and into a stream of, light, fast moving atomic species. As shown above, the velocity distributions of these latter species are forward peaked along the surface normal; any momentum transfer between atoms and macroparticles in the early stages of the expansion should thus also contribute a net forward velocity to the latter.
The temperature of the particulates calculated by fitting the emission spectrum attributed to black body radiation indicates that they are solid. This statement has been proven in a more direct way by putting a substrate in the vacuum chamber at a distance of ~3 cm. A large number of the ejected particulates scatter back from the surface of the substrate as shown in Figure 6.19. This behaviour can only be explained by assuming the particulates ejected as solid particles of graphite and propagate through the vacuum cooling down during their time of flight by radiation.
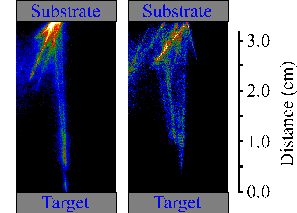
Figure 6.19: i-CCD camera images of large particulates reflected from the surface, at femtosecond laser ablation, the time delay is 50 ms and the gate is 500 ms.
6.4.3. Analysis of laser-irradiated region
The laser-irradiated region has been analysed by Raman spectroscopy and SEM imaging. Selected SEM pictures are presented in Figure 6.20. The surface of the irradiated region appear to have undergone a phase transition correlated with melting behaviour and a resolidification to what appears to be a glassy carbon melt. The melt looks smooth suggesting that this melting behaviour is not associated with explosive melting or phase explosion. Phase explosion occurs when the material is heated near to its critical temperature.29 Analysis of the black body radiation of the ejected particulates indicates that this temperature is not reached during either the pico- and femtosecond ablation of graphite.
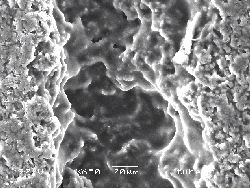
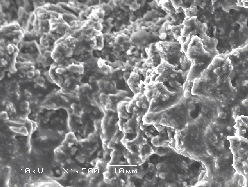
Figure 6.20: (a) Low and (b) higher resolution SEM images of the irradiated spot. (a) Shows the ablation track and (b) shows a detail of the graphite surface, post ablation.
The proposed phase transition during ablation is supported by Raman spectroscopy. Typical Raman spectra of non-irradiated graphite and the target surface post ablation are presented in Figure 6.21. These spectra indicate that the graphite in the irradiated spot has undergone a phase transition from graphite to amorphous carbon containing some fraction of tetrahedral co-ordinated carbon.
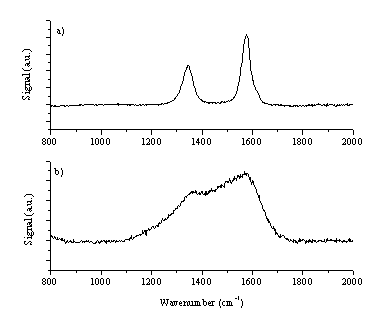
Figure 6.21: Selected Raman spectra of the target (a) non-irradiated graphite target (b) target after irradiation.
These results can be compared with those obtained by Shirk et al.14 They use Raman spectroscopy to compare the surface of the target before and after ablation for laser pulses with durations varying from 120 ns to 20 ps. This study inferred the operation of a surface phase transition towards DLC at all pulse durations studied, consistent with the present results.
6.4.4. Analysis of deposited films
Films have been deposited for a duration of 20,000 laser pulses in vacuum with the femtosecond laser. The deposited films have also been analysed by Raman spectroscopy and SEM imaging. The SEM images show a nanometer smooth film, with a large amount of micrometer sized (0.5-1 mm) particulate inclusions, a typical picture is shown in Figure 6.22. This observation is consistent with the observed abundance of ejected particles.
Figure 6.22: SEM picture of the film deposited via femtosecond laser ablation (2.1 J/cm2) at a distance of 5 cm.
Raman spectra of this film are given in Figure 6.23. The Raman spectra are consistent with a thin film of amorphous carbon with graphite particulates included within the film. As discussed in reference [25], the observed double peak behaviour in the Raman spectrum indicates a poor quality amorphous carbon film. The film is clearly very thin, given the obvious strength of the Si feature at ~960 cm-1 in comparison with the features from the film. The large graphitic particulates embedded in the film exhibit peak broadening as compared to the Raman spectrum of the graphite target (Figure 6.21) implying that the deposited particulates are subjected to internal stresses.
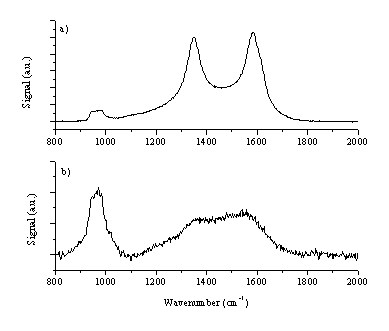
Figure 6.23: Raman spectra of the deposited films (b) Raman spectrum focused at a smooth part of the film (a) Raman spectrum focused on an micrometer size embedded particle. The feature at ~960 cm-1 is a feature of the Si substrate used.
6.5. 248 nm femtosecond laser ablation of Silicon(111)
6.5.1. Optical Emission Spectroscopy
As a comparison, the 248 nm femtosecond laser ablation of silicon in vacuum was also studied via optical emission spectroscopy and i-CCD camera imaging of the plume. Optical emission spectra of the ablation plume, recorded at distances of 0.5 and 5 mm from the target surface, are shown in Figure 6.24. The most intense emission lines can be attributed to electronic transitions of the silicon atom (390.6 nm), the silicon cation (385.6, 412.8, 505.6 nm) and the silicon dication (380.7, 456.8 nm). In addition spectral lines attributable to emission from the silicon trication (408.9, 411.6 nm) are discernible. Although the degree of ionisation is higher than in the graphite case, this is in part a reflection of the lower ionisation potential. Given that we observed optical emission from Sin+ ions with n < 4, we assume the presence of Si4+ cations in the ablation plume. The total ionisation energy associated with formation of the silicon tetracation is 107.13 eV while the energy necessary to obtain the silicon pentacation is much higher (273.9 eV). By way of comparison, the energies necessary to obtain the carbon trication and tetracation are 83.53 eV and 148.02 eV [27], respectively. The observation of C2+ emission (from e- + C3+ recombination) but not C3+ emission in the case of 248 nm femtosecond ablation of graphite implies that the degree of electronic excitation of the plume following ablation of silicon is of similar magnitude to that found in the case of graphite.
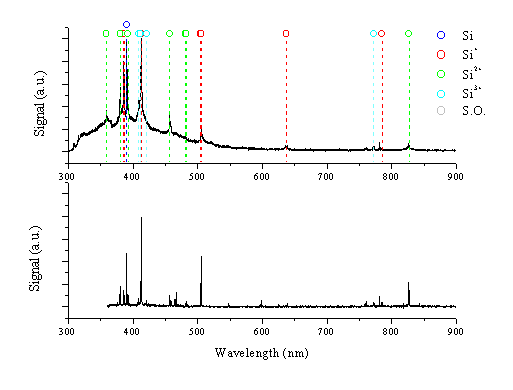
Figure 6.24: Optical emission spectra of the plume arising in the femtosecond 248 nm laser ablation of silicon recorded at distances of 0.5 and 5 mm from the target.
The optical emission of silicon at 0.5 mm consists of broad emission features with a superimposed line spectrum. The spectral lines are significantly broadened, compared to those in spectra taken at 5 mm, presumably because of pressure broadening due to the high charge density in this region. The emission spectra taken using the graphite target exhibit similar behaviour, although less pronounced. The broad emission feature centred around 400 nm is attributable to Bremsstrahlung arising from the electrons in the plume. In addition the spectrum exhibits a continuum emission attributable to black body radiation. At distances further from the target (5 mm) the spectrum displays well-resolved emission lines.
To obtain additional time resolved information about the optical emission, wavelength resolved spectra have been recorded in 50 ms time gates at a distance of 5 mm. A rough indication of the velocity for the different species contained within the plume can be inferred from such time resolved spectra by plotting the intensities of selected emission lines versus the delay time, and then calculating the velocity of the emitting species by dividing this distance by the time where the emission peaks. The ‘Time Of Flight’ spectra so obtained are given in Figure 6.25. The peak velocities so obtained are ~20 km/s for the silicon atom, ~40 km/s for the silicon cation and > 60 km/s for the silicon dication. Clearly, the velocity of the cation scales with its charge, as was observed in the nanosecond laser ablation of graphite. Such behaviour could not be confirmed in the case of the picosecond and femtosecond laser ablation of graphite since the emission at longer distances was not intense enough to allow reliable time of flight analysis.
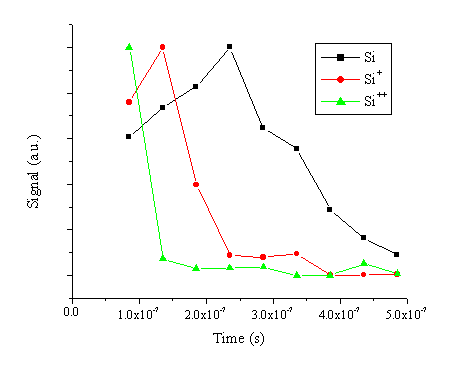
Figure 6.25: The time resolved optical emission of different Si emissions. The emission was recorded in 50 ms time gates at 5 mm from the target surface.
A black body radiation curve was fitted to the continuum emission at wavelengths longer than 400 nm, corrected for the quantum efficiency of the spectrometer and the i-CCD array. The calculated temperature equates to 2500 ± 200 K. This temperature is above the melting temperature (1693 K) but below the normal boiling temperature (2873 K) of silicon [28]. This would suggest that the particles giving rise to this black body radiation are molten droplets of silicon. Further evidence in support of this observation is presented in the next paragraphs.
6.5.2. i-CCD camera images
The temporal behaviour of the total optical emission was studied in more detail by means of i-CCD images. Time resolved i-CCD camera images recorded at different delay times are shown in Figure 6.26. The pictures illustrate clearly that by 100 ns the total emission has split into at least two components.
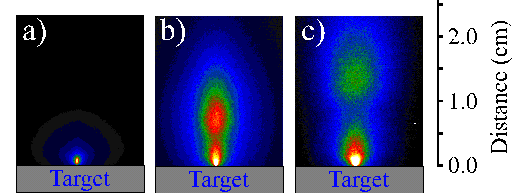
Figure 6.26: i-CCD images of the plume arising from femtosecond laser ablation of silicon (a) after 40 ns, (b) after 160 ns and (c) after 300 ns. The spectra are recorded with a time gate of 20 ns.
This plume splitting behaviour is consistent with the observations obtained from optical emission spectroscopy. The velocity of the fast component can be estimated from cuts through the images along the surface normal. The cuts show a pronounced double peak structure on time scales above 100 ns. By taking the peak value of the fast moving component and plotting its distance from the target versus the time delay we can obtain a velocity for the fast moving component. The results of this procedure are given in Figure 6.27. The velocity so derived ~50 km/s is in reasonable agreement with that deduced for the emitting Si+ from the OES measurements. Establishing a velocity for the slower component proved to be impossible because of the hot spot remaining just in front of the target.
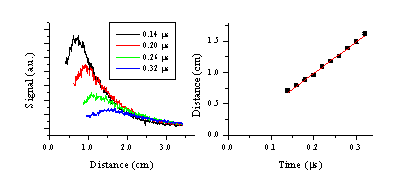
Figure 6.27: (a) Time of Flight transients obtained from cuts along the surface normal through the i-CCD camera images at different time delays, the slow part of the OES has been omitted from the transients. (b) The mean distance versus time plot obtained from the transients given in (a).
A yet faster emission component associated with the silicon dications, as inferred from the time resolved optical emission, is not observed in the i-CCD camera images. The fast signal obtained from the i-CCD camera images might provide a merged picture of both of the silicon cation and dication emissions.
The emission behaviour at late times was also investigated by i-CCD camera imaging. In contrast to graphite ablation, no incandescent tracks were observed but, as Figure 6.29 shows, a more continuous emission was evident in images recorded at long delay times. This variation might be connected with a difference in size and aggregation state of the ejected particles, which are assumed to be liquid droplets in the case of silicon (as opposed to solid particulates in the case of graphite).
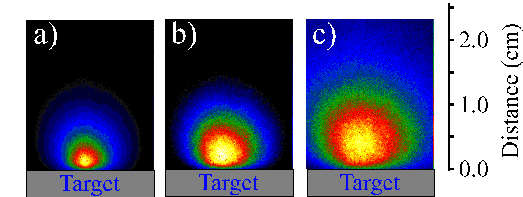
Figure 6.28: Slow particle distribution (integration of 200 shots) of the black body radiation of the plume following the 248 nm femtosecond laser ablation of silicon, observed using a 1 ms time gate delayed by (a) 40 ms (b) 80 ms and (c) 130 ms.
The mean velocity of these emitting particles was calculated using the same method as in the case of graphite ablation. The calculated velocity along the surface normal, together with the fit to a first order exponential curve are given in Figure 6.29, along with the angular distribution. The deduced velocity is comparable to that calculated for the graphite particulates previously, although the plume is less forward directed (n=3.1) than in the case of femtosecond laser ablation of graphite.
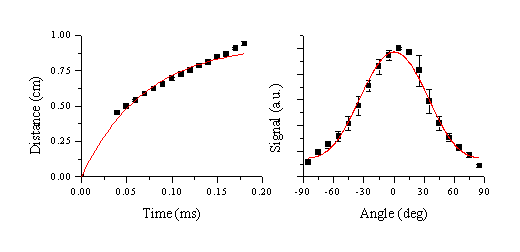
Figure 6.29: Velocity distribution of the slow particles. (a) centre of mass and (b) angular distribution for femtosecond ablation (dashed lines in (a) show the FWHM)
6.5.3. Analysis of laser irradiated target material
The region of the Si target irradiated by the laser pulses was analysed by SEM imaging. Selected SEM pictures are presented in Figure 6.30. The observed surface modification in the laser spot is consistent with melting behaviour. The image shown at larger magnification on the right shows the laser interaction region in greater detail. The unablated surface shows a typical nanometer smoothness of a polished silicon wafer.
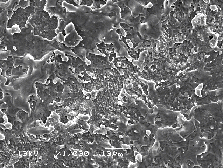
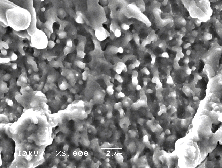
Figure 6.30: Selected SEM pictures of the laser irradiated region (a) low resolution and (b) high resolution.
The observed surface roughness and the apparent droplet formation suggest a very violent phase transition from the liquid to the gas phase. This picture is consistent with the process of explosive boiling or phase explosion [29]. Phase explosion is the process where, because of the high energy input (laser light), the melt is taken close to its critical temperature. An explosive boiling process occurs, not only at the surface but also throughout the melt, transforming the melt into a coexistent mixture of gas with molten droplets. After the phase transition, the gas phase expands into vacuum carrying the ejected droplets.
From the observed size distribution of the droplets remaining on the surface we might suggest that the average droplet size is ~ 250 nm. Such ejected droplets will undergo evaporative cooling and also cool via emission of black body radiation during their free flight.
6.6. Results and Conclusion
6.6.1. Comparison of nanosecond, picosecond and femtosecond laser ablation of graphite
Both the i-CCD camera images and the optical emission show a component attributable to C2 emission just in front of the target when ablating with any of the three pulse durations. As argued in the nanosecond case, this emission probably involves a component from recombinational products of C atom collisions. The absence of C atom emission in the pico- and femtosecond laser ablation case would then suggest that there must be a significant amount of non-emitting, ground state, carbon atoms in the ablation plume available to form the dicarbon radicals. Another likely creation mechanism is the dissociative recombination of larger carbon clusters. These observations can be discussed in the framework of the two-temperature model. As mentioned previously, the two-temperature model provides a theoretical explanation for the thermal processes involved in ablation at short time-scales. After laser excitation the electron distribution energy flows into the lattice via electron-phonon coupling (typical time scale = 1-5 ps). The hot lattice will emit particles following a purely thermal mechanism, mainly in their ground state or in fast decaying excited states (governed by the Boltzmann distribution for the surface temperature). Since, for short pulse durations, this process takes place after cessation of the laser excitation, there is no interaction between the emitted particles and the laser light. These particles would thus remain in the ground state and would not be detected by optical emission.
As argued in the last two paragraphs, both of the models traditionally used to describe ablation at short time scales contribute to our understanding of the behaviour of the ejected particles. The plasma-annealing process suggests electronic excitation of the lattice, and explains the observed emission of a highly ionised plasma ball, while the two-temperature model accounts for thermal features of the ablation process.
In addition, at late time scales, a plume component is observed that is associated with ejection of large particles from the target. The temperature implied by analysis of the accompanying black body radiation indicates that the particles are solid lumps of material ejected by the target. The velocities of the ejected particles arising in both the pico- and femtosecond ablation experiments are comparable, and the velocity distribution is highly forward peaked. The velocity of the particulates exhibits an apparent deceleration, which is explained by the underdetection of the lighter, and faster, particulates at later time delays. The initial velocity (~160 m/s) can give an estimation of the particle size of the ejected clusters Cn (n = ~275). The plume is highly forward peaked and that can be explained as an effect of the 2D imaging of a 3D event and ejection of a microscopically rough surface. Additionally, the forward velocity of the particulates can result from the collisions of these particulates with the highly forward peaked plasma flow in the initial stages of the plume expansion.
Analysis of the deposited film showed a nanometer smooth film with a large number of incorporated carbon particles. Analysis of the ablated area on the graphite target showed evidence for local melting, consistent with arguments that a thermal mechanism (the two-temperature model) contributes to the overall ablation process. The melted surface appeared smooth, suggesting that explosive boiling does not occur during this ablation.
A last point to address is our non-observation of any suprathermal component to the cation velocity distribution. This could be due to several reasons. The suprathermal distribution is likely to consist of highly charged cations, which may have a low emission yield in the monitored wavelength range. In addition any such component would experience a lower degree of three body recombination due to its high forward velocity and consequent rapid thinning of this plasma component.
6.6.2. Comparison with the femtosecond ablation of Si(111)
The emission plume arising after femtosecond irradiation of silicon showed the same multi-component structure as observed in the case of graphite. Plasma emission was observed, from (at least) three types of emitting species, each with a well-distinguished velocity distribution. The Si2+ ions travel with a velocity > 60 km/s, the silicon cations expand at ~ 40 km/s and the silicon atoms propagate at ~ 20 km/s. The observed plume splitting provides evidence for an acceleration mechanism in which the fast electrons and the cations decouple from the rest of the plume, giving rise to suprathermal velocities for the higher charged cations. The observation of such highly ionised plasma suggest that most of the underlying physics of femtosecond ablation of silicon is well described by the plasma-annealing model. In addition, a high-density region of slow moving material just in front of the target was observed. The temperature inferred from the black body radiation emanating from this region is ~ 2500 K, indicating some contribution from a thermal mechanism i.e. the two-temperature model to the overall ablation yield.
The target also ejects large particulates as illustrated by the i-CCD camera images. These large particulates travel with a velocity of ~ 30 m/s and with a highly forward peaked velocity distribution. Such observations are consistent with the evidence for explosive boiling obtained by SEM images. The behaviour of these particles can be explained with the framwork of molecular dynamics studies of the picosecond laser ablation of silicon [30]. This latter study predicts a highly forward peaked distribution for the ejected large particles, and velocities up to 1 km/s. The apparent difference between the theoretically predicted and the experimental velocities may be attributable to the size of the calculation, since the simulation box included 32,400 atoms, which equates to a size of 5 ´ 5 ´ 27 nm. The experimental evidence hints that the ejected particles are much larger (~250 nm diameter) and consequently much slower.
The difference observed in ejection behaviour between carbon and silicon can be rationalised as follows: graphite has a much higher melting temperature and critical temperature than silicon. Silicon will thus be easier to excite to its critical temperature, thus more likely to show evidence for explosive boiling, while graphite will tend to ‘cool’ via fast sublimation of the solid and/or evaporation of the melt.
6.6.3. General conclusion
The optical emission from the plume arising in graphite and silicon ablation with short laser pulses exhibits a similar multi-component structure. The ejected plume consists of both non-thermal and thermal components, the non-thermal component being the ejected plasma and the thermal component consisting of large particles and very probably also non-emitting species. Both the emitting plasma and the particles exhibit a highly forward peaked velocity distribution.
These observations have important implications for film deposition with short pulse laser irradiation. For carbon, most applications require films grown with few, or preferably no embedded particulates. The results of this study indicate that the large particles could be avoided by implying an appropriate velocity filter. Deposition from femtosecond ablation has a number of disadvantages compared with the nanosecond deposition, experimental complexity, the ablation rate is much lower, and the film quality (sp3/sp2 fraction) is inferior. For silicon, on the other hand, the results suggest that laser ablation with short pulse durations might be used as a source of silicon nanoparticles.