6. Results for H/C/S Systems
6.1. Introduction
This chapter presents the results of MWCVD diamond growth experiments using H/C/S containing gas mixtures such as xH2S/1%CH4/H2 (x=0-0.5%) and 0.5%CS2/H2. OES and MBMS have been used to investigate the gas-phase chemistry occurring in such systems for both microwave (MW) and hot filament (HF) activation. Furthermore, these results have been correlated with those of SENKIN computer simulations. These simulations have led to the proposal of a parameter, Fs, which predicts the degree of S-incorporation into diamond films. Fs is defined as the product of the SENKIN predicted mole fractions of CH3 and CS, [CH3]´[CS].
6.2. Diamond Deposition From H2S/1%CH4/H2 Gas Mixtures
MPCVD experiments were undertaken in which films were deposited using xH2S/1%CH4/H2 (x=0-0.5%) gas mixtures with applied microwave power of 1 kW and pressure of 40 Torr. Growth was carried out at a substrate temperature of 900°C (as discussed in Section 3.2.9). Diamond films were analysed by SEM, LRS, four-point probe and XPS, as discussed below. MW deposited films are also compared with films grown using HF activated gas mixtures
6.2.1. Film Crystallinity
Films deposited by MWCVD were analysed by SEM in order to investigate the effect on film crystallinity and facet size of H2S addition to a 1%CH4/H2 gas mixture. Electron micrographs of three such films are presented in Figures 6.1(d)-(f). These are compared with images of films deposited using HF activated H2S/1%CH4/H2 gas mixtures under similar conditions (Figs.6.1(a)-(c)).
Figure 6.1. SEM micrographs
for films grown using 1%CH4/H2 gas mixtures with H2S
additions of (a) 100, (b) 6000 and (c) 10000 ppm, in a HF reactor, and (d) 100,
(e) 1000 and (f) 5000 ppm additions in a MW plasma reactor. Conditions: total gas flow 200 sccm,
growth time 8 h, substrate temperature 900°C, pressure 20 Torr
(HF) and 40 Torr (MW), 1 kW applied microwave power or filament
temperature of 2200°C. Note Figs (a)-(c) are
adapted from Reference [1].
Figure 6.1 shows that there is little change in film morphology between samples deposited with 100, 6000, and 10000 ppm H2S addition to a HF activated 1%CH4/H2 gas mixture. In contrast, Figs.6.1(d)‑(f) show that for MW deposited samples there is a noticeable variation in film morphology with increased H2S input level. Increasing the H2S input levels from 100 to 1000 ppm (Figs.6.1(d) and (e)) significantly increases the proportion of (100) oriented facets, whereas further increasing H2S levels to 5000 ppm (Fig.6.1(f)) results in the crystal facets taking on a rounded appearance.
It was also observed that additions of over 1000 ppm H2S to the plasma caused the deposition of a layer (~0.5 mm thick after a few hours) of yellow powdery sulfur on the colder parts of the chamber, such as the walls and windows. Although S deposition was also encountered during the HF growth experiments, it only occurred with the highest H2S concentrations (above 5000 ppm), and the rate of deposition was estimated to be about 10 times smaller than seen in the MW system. Some of this difference in behaviour may be attributable to the lower total power levels in the HF system (300 W) compared to the MW system (1 kW) and the smaller volume of activated gas in the former but, it also hints at significant differences in the gas phase chemistry between the two systems.
6.2.2. Film Growth Rate
Deposited film growth rate was calculated from the cross-sectional film thicknesses measured by SEM (Section 2.2). Comparison of the growth rates of HF and MW deposited films also highlights a major difference between the behaviour of these two systems. Figure 6.2 shows that increasing H2S addition causes a decrease in the growth rate of the deposited films, however this fall is far more pronounced in the case of MW activation. This effect for MW deposited film has been previously reported by others [[2]], but over a smaller range of H2S concentrations, although the reported effect was more pronounced.
Figure 6.2. Film growth rate
(measured by cross-sectional SEM) versus H2S addition for films
grown in H2S/1%CH4/H2 gas mixtures. Key: (·) HF, (■) MW deposited films, with
other process conditions as for Fig.6.1.
The lines are least square fits to linear functions. Note that HF data
were adapted from Ref. 1.
6.2.3. LRS Analysis of Films
Figure 6.3 shows laser Raman spectra of films grown from 1000 ppm H2S/1%CH4/H2 gas mixtures on (i) thin n-type and (ii) thick undoped Si substrates (see Section 3.2.6). The presence of a prominent diamond Raman line (1332 cm-1) in both spectra indicates that the quality of the deposited films is good, even at this relatively high level of H2S addition. In order to gain a more quantitative measure of diamond film quality a factor, Q, (see Section 2.3) was plotted as functions of H2S addition to a 1%CH4/H2 gas mixture (Figure 6.4).
Figure 6.3. Laser Raman spectra of films grown from 1000 ppm H2S/1%CH4/H2
gas mixtures on (i) thin n-type and (ii) thick Si substrates. The two spectra have been offset vertically
for clarity of presentation.
Conditions: as given in Figure 6.1.
Figure 6.4 presents plots of Q versus H2S addition to 1%CH4/H2 gas mixtures for both thin n-type and thick undoped Si substrates. A general fall in Q is observed upon increased H2S addition for both data sets, although the ratio is generally higher for the films grown on the thicker substrates. This finding is confirmed by inspection of the two Raman spectra presented in Figure 6.3. The growing diamond surface is closer to the visible edge of the microwave plasma during deposition using the thicker Si substrates. This is presumed to result in the deposition of films with a higher diamond (relative to graphite) content, maybe as a result of increased etching of the surface by gas phase radical species. Thus, the value of Q is greater for films grown on thicker substrates.
Figure 6.4. Plot of Q versus H2S addition to 1%CH4/H2
gas mixtures for LRS (514.5 nm) analysis of films grown on two types of
substrate. Conditions: as given in
Figure 6.1. Key: (·) thin n-type and (n) thick undoped Si substrates. Lines are least squares fits to linear
functions with the dashed line corresponding to the thick Si substrate data.
6.2.4. Four-point Probe Resistivity Measurements of Films
Four point probe measurements of film resistivity at room temperature are presented in Figure 6.5 and show the films to have significant resistance with values which are in the range usually observed for as-deposited or H-terminated CVD diamond films [[3]]. This may reflect the defective, polycrystalline nature of these heteroepitaxially-grown films. A clear drop in resistivity is observed between undoped (744 W cm) and doped samples (100 and 1000 ppm H2S, ~ 200 W cm). The small rise in resistivity between the 1000 and 5000 ppm H2S samples is probably due to the presence of additional grain boundaries containing impurities in the more highly doped films. Unfortunately, Hall effect measurements proved unsuccessful due to the high resistivity of these films, so the semiconducting properties of these samples remain unclear.
Figure 6.5. Plot of resistivity (as measured by four point probe) of
films versus H2S addition to a 1%CH4/H2 MW
plasma. Conditions: as given in
Fig.6.1.
6.2.5. XPS measurement of film S/C Ratio
Figure 6.6 shows XPS results for MW grown films. A linear increase is seen in the S/C ratio detected in the films with increased H2S concentrations, although only for dopant levels over 100 ppm (since below this value the S in the films was below the XPS detection limit). The sulfur 2p peak (compared to the literature value) for all films was observed to be shifted by ~1 eV to higher energy. This is a much smaller shift than was seen for the HF deposited film (with 6000 ppm H2S in the gas phase) [1], suggesting that S may be present in different bonding forms in the two types of sample. XPS spectra are presented in Appendix III.
Sulfur is present in much higher levels in the films grown using MW compared to those grown using HF activation, with values up to 0.2% being obtained. However, Figure 6.6 also shows that, even at this level, the S/C ratio in the deposited films is only ~1/200 that in the input gas mixture; the remainder is presumably pumped away or depositing as solid S on the walls of the reactor. Neither XPS nor SIMS showed any evidence of contamination by B or other unexpected n- or p-dopant atoms.
Figure 6.6. Plot of
deposited film S content (S/C ratio as measured by XPS) versus S/C ratio of input
gas mixture. Note that an input S/C ratio of 0.5 corresponds to a 5000 ppm
H2S addition to a 1%CH4/H2 gas mixture. Conditions: as given in Fig.6.1.
It should be noted that, although XPS is a very surface sensitive technique, it samples from a comparatively large surface area (~1 cm2), and so the position of the S within the film is ill defined. However, depth profiling shows that the S is uniformly distributed throughout the film depth, and not just at the surface (see Appendix III(a), page 4), but the spatial resolution of the technique is insufficient to determine if the S is concentrated in, say, grain boundaries.
6.3. Diamond Deposition From a CS2/H2 Gas Mixture
A film was also grown on undoped Si using a MW activated 0.5%CS2/H2 gas mixture. The film exhibited good crystallinity as determined by SEM (Figure 6.7) and was found to give a clear diamond Raman peak at 1332 cm-1 (Figure 6.8). The values of Id/IG and Q were calculated as 5.6 and 93%, respectively. Thus, the diamond film was concluded to be of high quality.
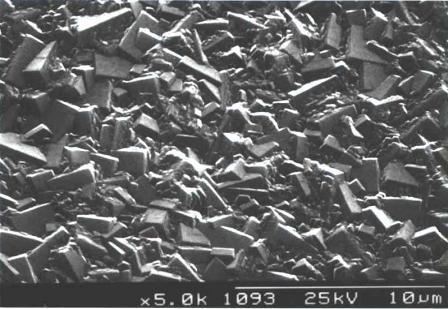
Figure 6.7. Scanning
electron micrograph of the surface of a film deposited from a 0.5%CS2/H2
microwave plasma. Conditions: total gas
flow 200 sccm, growth time 8 h, substrate temperature 900°C, pressure 40 Torr
(MW), 1 kW applied microwave power.
Figure 6.8. Laser Raman
spectrum (514 nm excitation) of a film deposited from a 0.5%CS2/H2
microwave plasma. The spectrum has been
fitted using a quadratic baseline and Gaussian curves centred at 1332
(diamond), 1330 (D band), 1389, 1532 (G band) and 2156 cm-1. Growth conditions: as given in Fig. 6.7.
Although sulfur was detected in the film (at an S/C ratio of ~ 0.16% as measured by XPS, i.e. an S/C ratio only ~1/1000 that in the input gas mixture), four point probe measurements showed the sample to be significantly more resistive than the S-doped examples from H2S/1%CH4/H2 gas mixtures, suggesting that little S incorporation into the lattice had occurred. As for H2S additions, a layer of S was deposited on the cool chamber walls.
6.4. OES of H/C/S containing Microwave Plasmas
Figure 6.9 shows the ratioed emission spectra from (a) a 1%H2S/1%CH4/H2 versus that from a 100%H2 plasma and (b) 0.75%CS2/H2 compared to 100%H2. This procedure serves to highlight the spectral features attributable to S addition. Both spectra are dominated by emission in the wavelength range 290-540 nm attributable to electronically excited S2 (B3Su-) radicals [[4]]. The emission is stronger for the CS2/H2 mixture, as reflected by the distinct blue colouration of the plasma observed when compared to H2S/1%CH4/H2 plasmas, probably due, in part at least, to the higher S content in the former mixture. Weak emissions due to CS are also observed from both plasmas (at ~257 and ~266 nm, associated with the A1P-X1S+ transition [4]).
Figure 6.9. Ratio plots of
(a) 1%H2S/1%CH4/H2 : 100%H2
and (b) 0.75%CS2/H2 : 100%H2
optical emission spectra. Conditions:
total gas flow 200 sccm, pressure 20 Torr, 1 kW applied microwave
power.
6.5. Molecular Beam Mass Spectrometry Studies of H2S/1%CH4/H2 Gas Mixtures
All MBMS measurements were made under the same conditions as the deposition runs, except microwave plasma measurements were made at the reduced pressure of 20 Torr. This was because the presence of the probe made the plasma unstable at pressures >20 Torr. Measurements were made of H2S/1%CH4/H2 microwave (MW) and hot filament (HF) activated gas mixtures as a function of H2S addition (0-1%) and HF temperature, Tfil. In addition, 1%CS2/H2 gas mixtures were investigated in terms of Tfil and applied microwave power.
Figure 6.10 shows how the mole fractions of the species: CH4, CH3, C2H2, H2S, CS2 and CS vary with increased H2S addition (0-10000 ppm) for both (a) HF and (b) MW activation. In the HF experiment (sampling gas 5 mm from the filament maintained at 2200°C), the CH4 and C2H2 mole fractions both reduce slightly with increased H2S addition (as shown in Fig.6.10(a)), whereas the mole fractions of H2S and CH3 rise. Unsurprisingly, the mole fraction of H2S measured in the gas phase is found to be proportional to the input concentration of H2S in the feedstock gas mixture. At higher H2S input fractions, CS2 is also present as a result of gas phase reactions, but the CS radical is not detected. In contrast, the addition of H2S into a 1%CH4/H2 MW plasma (Fig.6.10(b)) causes a significant reduction in CH4, C2H2 and CH3 mole fractions. H2S and CS2 are seen to rise with increased H2S addition with a measured CS2/H2S ratio ~ 2, and significant amounts of CS are now measured, in quantities comparable to those from CS2.
Figure 6.10. MBMS results of
species mole fraction, X, versus H2S addition to a 1%CH4/H2
gas mixture, for gas sampled from: (a) a distance of 5 mm from a hot
filament, and (b) the edge of a MW plasma ~ 23 mm from the plasma
centre. Conditions 20 Torr,
1 kW applied microwave power and filament temperature of 2200°C. Key: (·) CH4, (´) C2H2,
(▲) CH3, (□) H2S, (∆)
CS2 (о) CS.
Returning to HF activation, the dependence of species mole fraction on Tfil is illustrated in Fig.6.11. Mole fractions of both CH4 and H2S are seen to decrease for Tfil > 1400°C whereas C2H2 and CS2 concentrations rise in this temperature region.
Figure 6.11. MBMS plots of
species mole fraction, X, versus filament temperature for a 0.5% H2S/1%CH4/H2
gas mixture. The gas was sampled at a
distance of 5 mm from the filament and the pressure was maintained at
20 Torr. Key: (·) CH4 ,(´) C2H2,
(▲) CH3, (□) H2S, (∆)
CS2.
6.6. Molecular Beam Mass Spectrometry Studies of CS2/H2 Gas Mixtures
Presented in Fig.6.12 is the dependence of species mole fraction on (a) filament temperature and, (b) applied microwave power, for a 1% CS2/H2 gas mixture. In the HF experiment a clear decrease in CS2 concentrations is observed, along with a rise in H2S, CH4, and CH3 mole fractions for Tfil > 800°C. Increasing applied microwave power, over the range illustrated by Fig.6.12(b), has little effect on the relative concentrations of all species. Again CS2 and H2 react together to form H2S, CH4, C2H2 and CH3. No measurable amounts of CS were detected in either of the CS2/H2 experiments. One interesting observation was that the CS2/H2 plasma was larger in size than a H2S/1%CH4/H2 plasma (for the same applied microwave power). In all five MBMS experiments, no detectable levels of SH, S or S2 were observed.
Figure 6.12. MBMS plots of
species mole fraction for a 1%CS2/H2 gas mixture,
measured for various (a) filament temperatures, and (b) applied microwave
powers. Other conditions and gas
sampling details are as given in Fig.6.11.
Key: (·) CH4, (´) C2H2,
(▲) CH3, (□) H2S, (∆)
CS2.
6.7. Computer Simulations of H/C/S Gas Mixtures
SENKIN computer simulations of the gas phase chemistry of H/C/S systems were carried out using a combination of the Gri-Mech 3.0 and C-S linking reaction mechanisms (see Sections 4.5.1 and 4.5.2). The corrections made to MBMS measured species mole fractions and the use of these data to find an appropriate simulation temperature (1630 K) for SENKIN calculations are discussed in the following sections, as is the application of the model to data recorded using HF activated gas mixtures. All simulations assumed a reaction time of 5 s, as used for modelling of H/C/O systems (Sections 5.5 and 5.6).
6.7.1. Mass Balance Corrections to MBMS Data
The SENKIN program used was a zero dimensional kinetics simulation and as such had a number of restrictions (Section 4.9). These included the assumption of a constant temperature within, and no transport into and out of, the reacting volume. As a result, the mass balance of each element calculated from output species mole fraction, X, must match that calculated from the input species X. However, the calculated C-mass balance for the MBMS experimental species X for H2S/1%CH4/H2 gas mixtures (Figure 6.13(a)) was found to decrease with increased H2S addition, despite there being no change in the input carbon mole fraction. Therefore, all the MBMS species X data were scaled to obtain a constant C-mass balance, in order to allow comparison between SENKIN simulations and MBMS experimental measurements. Reassuringly, this procedure yielded reasonable values for S-mass balance, with C and S-mass balances being approximately equal for a C/S input ratio of 1 (i.e. 1% added H2S).
A drop in the total carbon balance was also found for experimental results from HF activated 0.5%H2S/1%CH4/H2 and 1%CS2/H2 gas mixtures (Figure 6.13(b) and (c)) as the filament temperature, Tfil, (and therefore gas temperature, Tgas) increased. This we attribute to the Soret effect, whereby a temperature gradient induces preferential diffusion of heavier components of a gas mixture (e.g. CS and CS2) away from the higher temperature filament/sampling orifice region (see Reference [5] and references therein). This effect conceivably might also contribute to the drop in C-balance observed in the MBMS measurements with increasing H2S addition to a MW plasma activated 1%CH4/H2 gas mixture, as more CH4 is converted to the heavier species CS2, which then preferentially diffuses away from the hot sampling region, thereby lowering the measured C-balance.
Therefore, the two HF datasets were also corrected to obtain a constant C-mass balance. Again, this correction yielded reasonable S-mass balance values, with measured S/C mass balance ratios of ~0.44 and ~2 calculated for input gas mixtures containing S/C ratios of 0.5 (i.e. 0.5%H2S/1%CH4/H2) and 2 (i.e 1%CS2/H2), respectively. It should be noted that the C-mass balance for the corrected data for the H2S/1%CH4/H2 gas mixtures presented in Figure 6.13(a) is ~0.5% for an input C mole fraction of 1%. It is assumed that this is a result of the Soret effect causing the measured C-mass balance to be lower for a hot 1%CH4/H2 plasma (Tgas ~ 2000 K), compared with that present within the same gas mixture at room temperature.
Figure 6.13. Plots of C and S-mass balance versus H2S addition for (a) H2S/1%CH4/H2 gas mixtures and Tfil for (b) a 0.5%H2S/1%CH4/H2 and (c) a 1%CS2/H2 gas mixture. Conditions: as given in Figure 6.10-6.12. Key: (□) Uncorrected MBMS measured S-mass balance, (∆) Uncorrected MBMS measured C‑mass balance, solid symbols correspond to data corrected to maintain a constant C-mass balance.
6.7.2. Simulation Temperature
Figure 6.14 shows plots of SENKIN predicted species mole fraction, X, versus H2S addition to a 1%CH4/H2 gas mixture, for a range of gas temperatures. It is clear from Figure 6.14 that the predicted mole fraction of H2S, [H2S] and CS2, [CS2], both fall as the simulation temperature is increased from (a) 1540 to (e) 1720 K. The best agreement with the MBMS measured values of [H2S] and [CS2] (corrected as discussed above) was obtained using a temperature of 1630 K.
Increasing the simulation temperature over this range also has the effect of lowering the predicted [CH4] while causing an increase in predicted [C2H2]. The mole fraction of these two species is predicted to reach equality at ~1660 K, beyond which [C2H2] > [CH4]. This is the opposite ordering to that seen for the MBMS measured [CH4] and [C2H2]. Thus it was concluded that a temperature of 1630 K yielded predicted [CH4], [C2H2] and [CH3] with the best agreement with MBMS measured mole fractions, in terms of a compromise between absolute values and general trends in X. Further discussion regarding the results of SENKIN simulation using a temperature of 1630 K will be given in Section 6.7.3.
Figure 6.14. Plot of species mole fraction, X,
vs H2S addition to a 1%CH4/H2 gas mixture for
both MBMS measurements from a microwave plasma (adapted from Figure 6.10(b))
and SENKIN calculations assuming a simulation time of 5 s and temperature
(a) 1540, (b) 1600, (c) 1630, (d) 1660 and (e) 1720 K. Conditions: Pressure 20 Torr, MW power
1 kW. Key: experimental MBMS mole
fractions, scaled to maintain a constant carbon mass balance (·) CH4, (´) C2H2, (▲) CH3,
(□) H2S, (∆) CS2, (о) CS. SENKIN calculated mole fractions are solid
lines coloured to correspond with MBMS symbols.
6.7.3. H2S/1%CH4/H2 Gas Mixtures
Figure 6.15 shows a plot of species mole fraction against H2S addition for both MBMS measurements of a microwave (MW) activated xH2S/1%CH4/H2 mixture and the corresponding SENKIN calculations at a fixed gas temperature of 1630 K. The MBMS measurements have been scaled so as to maintain a constant total carbon mass balance (see Section 6.7.1).
Figure 6.15. Repeat of Figure 6.14(c). Please refer to Figure 6.14 caption.
It is evident that the trends in measured hydrocarbon species concentrations are reproduced well by SENKIN, with CH4, C2H2 and CH3 mole fractions all dropping with increased H2S addition. However, relative to the experimental measurements, the mole fraction of the methyl radical, [CH3], is consistently underestimated while [CH4] and [C2H2] are both overestimated by the calculations. The general trends in [CS2] and [H2S] are reproduced well by SENKIN, with both species mole fractions rising with increased H2S addition. The absolute species concentrations predicted by SENKIN also agree well with MBMS measurements for the MW activated xH2S/1%CH4/H2 gas mixtures.
The discrepancies between calculation and experiment outlined above could be due to a number of different factors. First, the uncertainty in species concentrations determined by MBMS sampling is estimated to be ~5% for stable species (e.g. CH4 and C2H2) and 30% or more for radicals such as CH3 [[6]]. Another source of potential disagreement is the fact that SENKIN is a zero-dimensional model, with deficiencies as discussed in the previous section. Experimental measurements are made of a dynamic three-dimensional system with many processes occurring (e.g. transport of species between areas with varying gas temperatures) which are not included in the SENKIN model. Taking this into account the level of agreement achieved between experiment and simulation is quite remarkable.
The concentration of CS predicted by SENKIN is approximately one order of magnitude larger than the MBMS results. This discrepancy may be due to the calibration method used in the MBMS experiments to convert raw CS counts into mole fractions. This requires an estimate of the partitioning between background CS present within the mass spectrometer and that originating from within the molecular beam of gas sampled from the plasma. The value of this partition coefficient was assumed to be the same as determined previously in MBMS measurements of CH3 radical mole fractions [5]. We suspect that this results in an underestimation of [CS], which would account for the drop in carbon balance observed upon increased H2S additions.
In addition, we note that the main proposed loss mechanism for CS is the reaction of HS and CS to form H and CS2 (Reaction 10 in Table 4.2), which we have modelled assuming kinetic data for the analogous reaction between HO and CO. If these latter data are an underestimate, and the loss rate of CS is actually faster, then the SENKIN calculations will overestimate [CS]. However, the trend in measured [CS] with increased H2S addition is reproduced well by simulation.
Figure 6.16(a) shows plots for a 0.5% H2S/1% CH4/H2 gas mixture of experimental MBMS species mole fractions, measured in a HF reactor at a distance of 5 mm from the filament, presented as a function of filament temperature, Tfil. SENKIN results for the same gas mixture are presented in Figure 6.16(b) as a function of gas temperature Tgas. As there is a steep gradient in the gas temperature [14] between the filament and the point at which MBMS sampling occurs (5 mm distance from HF) there is an offset between the temperature scales attached to the experimental MBMS measurements and the SENKIN calculations of species mole fractions, and only qualitative comparisons are really possible. However, it can be seen that there is generally good agreement between experiment and simulation, with the overall species trends and relative mole fractions measured by MBMS being reproduced well by SENKIN. Mole fractions of both CH4 and H2S reduce, while [CS2] and [C2H2] both rise with increased temperature, for Tgas > 1350 K. However, it should be noted that CS is also predicted to occur in significant concentrations, but was not detected experimentally.
Figure
6.16. Plots of (a) MBMS experimental species mole fractions vs filament
temperature for a HF activated gas mixture with gas sampled from a position
5 mm from the filament (scaled from Figure 6.11 to maintain a constant
carbon mass balance) and (b) SENKIN calculated mole fraction vs gas temperature
for a reaction time of 5 s.
Conditions: pressure 20 Torr, gas mixture 0.5%H2S/1%CH4/H2. Key: (·) CH4, (´) C2H2,
(▲) CH3, (ÿ) H2S, (∆)
CS2, (о) CS.
6.7.4. 1%CS2/H2 Gas Mixture
Similarly, experiment and simulation are in good qualitative agreement for an HF activated 1%CS2/H2 gas mixture (see Figure 6.17), with CS2 breaking down as the temperature is increased, and undergoing reaction to form CH4, H2S and C2H2. Again, there is a discrepancy between the data sets, with no CS measured experimentally while SENKIN predicts that it should be present in significant concentrations. Again this may be a reflection of the large temperature gradients present in the HF reactor, compounded by any inadequacies in the temperature dependence of the CS chemistry used in simulations.
Figure 6.17. Plots of (a) MBMS experimental species mole
fractions vs filament temperature for a HF activated gas mixture with gas
sampled from a position 5 mm from the filament (scaled from Figure 6.12 to
maintain a constant carbon mass balance) and (b) SENKIN calculated mole
fraction vs gas temperature for a reaction time of 5 s. Conditions: pressure 20 Torr, gas
mixture 1%CS2/H2.
Key: (·) CH4,
(´) C2H2,
(▲) CH3,
(□) H2S,
(∆) CS2, (о) CS.
6.8. Discussion
H2S addition to a 1%CH4/H2 mixture in these experiments is seen to have very different effects depending upon whether the mixture is HF or MW activated. For diamond grown in a HF reactor, addition of trace amounts of H2S has little effect on the crystallinity, growth rate and quality of the films. Relatively high input levels (>5000 ppm H2S) are required in order to obtain even trace amounts of S within the films, and the films remain highly electrically resistive [1].
In contrast, MW plasma CVD allows the incorporation of larger amounts of S (as indicated by XPS) at low H2S concentrations, although the incorporation efficiency is still low (i.e. the S/C ratio in the deposited films is only ~1/200 of that in the input gas mixture). It therefore seems that there is some significant difference between these two deposition methods as implemented here, which affects both the likelihood, and nature, of S inclusion into the diamond lattice.
Figure 6.10 shows a clear contrast in the gas phase chemistry between MW and HF activated CVD. In the HF system, upon addition of H2S to the 1% CH4/H2 mixture, CS2 is formed leading to a slight reduction in CH4 (and therefore CH3) concentrations. Importantly, the CS2/H2S ratio never exceeds unity and no CS is observed. In contrast, for MW plasmas the detected mole fraction of CS2 is ~4 times that of H2S at all H2S additions. CS2 and CS are detected in roughly equal amounts, and a much more significant reduction in CH4, C2H2 and also CH3 is observed, presumably because the ‘missing’ carbon is locked up in this CS/CS2 reservoir. As significant concentrations of CS are detected in the MW plasma (which facilitates S incorporation) but not in the region around the HF (which gives little S incorporation), we speculate that CS is the species responsible for the inclusion of S into the diamond films. The observed drop in CH3 mole fraction with increased H2S addition, the fall in MW deposited film growth rates, and the lack of such observations for the HF system, are all to be expected given that CH3 is believed to be the major diamond growth precursor in low pressure CVD reactors [[7]-[9]].
The reaction of H2S and CH4 to form CS2 is illustrated in Figure 6.11, where, for an input gas mixture of 0.5%H2S/1%CH4/H2, the reduction in CH4 and H2S concentrations and the increase in CS2, C2H2 and CH3 mole fractions with filament temperature are observed at Tfil > 1400°C. The chemistry of these H2S/CH4/H2 mixtures is summarised in Table 6.1, where the major overall processes and individual step reactions are listed, along with their forward rate constants (kF) and Gibbs free energies (DGreac) at 1100 and 1600 K.
|
|
kF / (cm3 mol-1 s-1) |
DGreac / (kJ mol-1) |
|||
|
Reaction |
1100 K |
1600 K |
1100 K |
1600 K |
|
|
1 |
CH4 + 2H2S ¾ CS2 + 4H2 |
|
|
23.6 |
-85.0 |
|
2 |
CS2 + H ¾ CS + HS |
8.476´108 |
3.709´1010 |
-4.6 |
-59.2 |
|
3 |
HS + H ¾ S + H2 |
1.301´1013 |
1.301´1013 |
-31.0 |
10.9 |
|
4 |
2HS ¾ S2 + H2 |
3.012´1010 |
3.012´1010 |
-42.6 |
43.2 |
|
5 |
H2S + H¾ HS + H2 |
2.756´1012 |
4.221´1012 |
-102.4 |
-140.9 |
|
6 |
CH4 + H ¾ CH3 + H2 |
3.842´1011 |
3.341´1012 |
-28.2 |
-42.6 |
|
7 |
CH3 + HS ¾ CH3SH |
9.998´1012 |
9.998´1012 |
-125.0 |
-55.6 |
|
8 |
CH3SH ¾ CS + 2H2 |
|
|
21.0 |
-99.1 |
|
9 |
CH3SH + H ¾ CH3 + H2S |
3.226´1012 |
4.096´1012 |
-71.8 |
-43.0 |
|
10 |
CH3SH + H ¾ CH3S +H2 |
8.824´1012 |
1.280´1013 |
-83.3 |
-84.1 |
|
11 |
SH + CH3 ¾ CH2S + H2 |
1.018´1012 |
1.018´1012 |
-120.8 |
-108.7 |
|
12 |
CH2S ¾ CS + H2 |
4.299´108 |
2.721´1010 |
16.1 |
-46.0 |
|
13 |
CS + H2S ¾ CS2 + H2 |
|
|
-97.8 |
-81.8 |
Table 6.1. Selected reactions
proposed for C/H/S gas mixtures within HF and MW diamond CVD reactors operating
at ~ 20 Torr. Forward rate
constants, kF, are calculated for Tgas =
1100 and 1600 K using Arrhenius parameters presented in Table 4.2 (excluding
data for Reactions 2 and 12 that were obtained using data for analogous O
containing species reactions from References [10] and [11],
respectively). Gibbs free energies of reaction, DGreac, presented for 1100 and
1600 K are calculated using free energies of formation taken from Ref.[12]. The data for Reactions 7 to 12 were computed
from CCSD(T)/cc-pVTZ//MP2/6-311G** electronic structure calculations, with free
energy corrections derived from the standard methods of statistical mechanics,
together with MP2/6-311G** rotational constants and vibrational
frequencies [[13]]. A conservative error estimate for this
procedure is 40 kJ mol-1.
The dominant overall chemical process for these systems is Reaction 1, in which CH4 and H2S are in equilibrium with CS2 and H2 (with DGreac of 23.6 and ‑85.0 kJ mol‑1, at 1100 and 1600 K, respectively). The equilibrium constant (the ratio of product/reactant concentrations) for Reaction 1 is K = 0.076 at a temperature of 1100 K and K = 595 at 1600 K (given that DGreac = ‑RT lnK).
CH4 + 2H2S ¾ CS2 + H2 Reaction 1.
At the higher temperatures, CS2 then reacts with atomic H producing CS and SH (Reaction 2) leading to a build up of CS, as seen for the MW system. Table 6.1 shows that Reaction 1 (formation of CS2 from H2S and CH4) is unfavorable (i.e. DGreac > 0) at lower gas temperatures. Tgas is known [[14]] to fall from ~2400 K at the HF to ~1800 K within a few mm, and to ~ 1100 K at a distance of 5 mm from the HF (from where the gas is probed by MBMS and where the substrate is located for diamond growth). In contrast, within a representative 1%CH4/H2 MW plasma the temperature does not vary considerably from the plasma centre (Tgas ~ 2200 K) [[15]], outwards to the plasma edge (Tgas ~ 1600 K for a radial distance of ~ 23 mm) [[16]], where gas is sampled in the MBMS experiments (and where the substrate is positioned for growth). The temperature gradient within a MW reactor is therefore much shallower compared with that around a HF, and the volume of gas with a temperature sufficiently high to favour formation of CS2 (through Reaction 1) is substantially larger within the MW plasma. Reactions 1 and 2 can therefore create CS2 and CS, respectively, throughout the entire plasma region, and both these species will be present in significant concentrations at the growing diamond surface. However, in the HF system, the temperature drop away from the filament is so severe that except very close to the filament the equilibrium (1) lies towards the left hand side, CS2 production is inefficient and so, as a result, is CS production (Reaction 2). Thus, the growing diamond surface in a HF system will see only those species responsible for normal CVD diamond growth (CH4, CH3, H atoms, etc.), as well as some H2S, CS2, but little or no CS. This results in diamond growth in HF systems being relatively unaffected by H2S addition and no S incorporation.
Another contrast between MW and HF deposition is the observation that for H2S concentrations over 1000 ppm, the former results in the deposition of a layer of sulfur powder on the cool chamber walls, whereas no such problem is encountered in the HF system. One possible explanation for this is that, in the MW plasma, the SH radicals which are formed in the plasma via Reaction 2, then diffuse out to the cooler regions of the reactor and there react with H to form S and H2 (as in Reaction 3). Reaction 4 shows an alternative route to sulfur deposition in which SH radicals recombine to form S2. In either case, the resulting (S or S2) species may diffuse to, and deposit on the chamber wall, or aggregate in the gas phase (catalysed by the presence of a third body) to make larger S-containing clusters, prior to depositing onto the chamber walls. Evidence for this comes from the detection of excited S2 radicals from H2S and CS2-containing MW plasmas using optical emission spectroscopy (see Figure 6.9). As discussed above, the production of CS (via Reaction 2) and, with it, HS, is significantly larger within the MW plasma compared to the HF environment. The extra HS in the MW plasma relative to the HF environment leads to increased S and S2 formation (via Reactions 3 and 4) and consequently, increased deposition of sulfur.
Reaction 1 is an overall equilibrium consisting of many intermediate step reactions, in which the chemistry is initiated by H-abstraction from CH4 and H2S to form CH3, SH and H2 (Reactions 5 and 6). Both of these reactions are thermodynamically favoured (DGreac < 0), over the temperature range presented in Table 6.1, although more so for H2S due to the lower bond dissociation energy for the H‑S bond (399 kJ mol-1) compared with the C‑H bond (435 kJ mol-1) [[17]]. The CH3 and SH radicals may then couple to form the predicted species CH3SH (Reaction 7, DGreac < 0 for Tgas = 1100‑1600 K). Reaction 7 is predicted to be the major route to CH3SH as the alternative processes (i.e. reaction of either CH3 and H2S, or SH and CH4, to produce CH3SH and H) are thermodynamically unfavorable (DGreac > 0) for Tgas = 1100‑1600 K. Table 6.1 shows that, at Tgas > 1600 K, CH3SH can undergo successive H-abstraction reactions to yield CS (Reaction 8). This overall process competes well against Reaction 9 (attack by H to form CH3 and H2S) because the initial abstraction of H (Reaction 10) is favoured. So once Reaction 10 has occurred, successive abstractions of H will result in the formation of CS. Reactions 11 and 12 provide an alternative route to the production of CS, whereby SH and CH3 react to form CH2S which in turn undergoes successive H-abstraction reactions to form CS. This CS goes on to form CS2 via (the favoured) Reaction 13.
Figure 6.12 illustrates the multi-step conversion of CS2 and H2 in the HF reactor to reform H2S and CH4. This is, in effect, the reverse of overall Reaction 1 which, although unfavorable for Tgas > 1200 K, will be driven in the cooler regions of the reactor where H2 and CS2 concentrations are high (and are essentially the input gas mixture). Diffusion of the products into the hotter regions leads to the formation of CH3 (the diamond growth species), thus allowing the deposition of diamond from such gas mixtures, as previously reported [[18]]. This process, whereby the input gases react prior to entering the hot region of the reactor, has many similarities with the mechanism for CH3 production from HF activated C2H2/H2 gas mixtures proposed in Reference [19].
It is interesting to note that despite the high input concentration of CS2 in the 1%CS2/H2 gas mixture, no CS was detected in either the HF or MW MBMS experiments (Fig.6.12). The reason for this may be that Tgas is lower for the 1%CS2/H2 plasma than the H2S/1%CH4/H2 plasmas. This is indicated by the larger size of the plasma ball in the former case (at a fixed power input) resulting in a lower power density, and thus a lower average temperature, within the plasma. The formation of CS from CH3SH (Reaction 8) becomes unfavourable for Tgas < 1200 K. The uncertainty in the calculation of DGreac for this reaction is ~40 kJ mol-1, corresponding to an error of ~200 K in the temperature quoted above. Reaction 8 is thus calculated to become unfavoured thermodynamically within the range 1000 < Tgas <1400 K. If the outlying regions of the 1%CS2/H2 plasma are within this temperature range, then the reverse reaction now becomes spontaneous. The resultant CH3SH then reacts with atomic H to produce CH3 and H2S (Reaction 9). The residual HS radicals formed within the 1% CS2/H2 MW plasma (via Reaction 2 and the reverse of Reaction 7) could then diffuse to the cooler regions of the chamber and react to form S and S2 (see Reactions 3 and 4), leading to the observed sulfur deposition on the cool chamber wall.
Deposition from a 0.5%CS2/H2 MW plasma yielded a diamond film of good crystal quality, containing ~0.16% sulfur (as detected by XPS) but with a resistivity significantly greater than that measured for the H2S grown examples. This indicates that, in this case, either (a) the S had not been incorporated into the diamond lattice in an electronically active form, or (b) there were an even greater number of compensating defects and acceptor states. This provides further evidence for the role of CS as a route to electronically-active sulfur incorporation, since no CS was detected by MBMS in the CS2/H2 plasma (as discussed above).
If it is assumed that (a) the diamond growth species is the methyl radical, as is now generally assumed in all other low power H2 rich CVD environments [8,9], and (b) CS facilitates sulfur incorporation into diamond films, then it is possible to gain some insight into the optimum growth conditions for S-doped diamond films by defining a parameter, Fs, corresponding to the product [CH3]×[CS]. Fs reaches a maximum, in the case of SENKIN calculations for xH2S/1%CH4/H2 gas mixtures (Tgas = 1630 K), at H2S additions of x~ 0.55%, as illustrated in Figure 6.18(a).

Figure 6.18. Plots of Fs
vs (a) H2S addition to 1%CH4/H2 gas mixtures (Tgas = 1630 K)
and (b) gas temperature for 1%CS2/H2 and 0.5%H2S/1%CH4/H2
mixtures as predicted by the SENKIN calculations. Conditions: pressure 20 Torr, reaction time 5 s.
Figure 6.18(b) shows plots of Fs versus gas temperature for SENKIN calculations for 0.5%H2S/1%CH4/H2 and 1%CS2/H2 gas mixtures. The smaller values of Fs calculated for the 1%CS2/H2 gas mixture are consistent with the smaller degree of S-incorporation (i.e. input S/C ratio in feedstock mixture: S/C ratio measured for deposited films) seen for films deposited using such mixtures.
It is also clear that both of these plots show maxima at Tgas~1600 K. Since this matches closely with the Tgas of the plasmas previously used in previous, generally unsuccessful, attempts to obtain S-doped diamond (see Sections 6.2 and 6.3), it is clear that the ability of the studied H-C-S containing gas mixtures to deposit S-doped diamond in which the sulfur is incorporated into the diamond lattice in an electronically active state must depend on factors other than the temperature of the activated gas above the substrate during diamond CVD.
One such factor might be the temperature gradient (and therefore distance) between the HF or across the MW plasma sheath and the substrate, which could influence the transport and reaction of species produced in the plasma (e.g. CH3 and CS) as they diffuse towards the substrate. Perhaps notable in this regard is the tendency for yellow sulfur to deposit in the cooler regions of the chamber walls, implying surface loss processes not included in the model. A potentially more important factor is the substrate temperature, as this can govern the various gas‑surface reactions and any migration of surface species, thus influencing whether S‑incorporation occurs within the diamond lattice (either substitutionally or interstitially) or the grain boundaries.