Chapter 5
The Electrochemistry of Highly Doped Diamond Films
5.0 Outline
·
This
chapter contains details of the apparatus used for the electrochemical
experiments in these studies.
·
The
chapter describes the electrochemistry of highly doped diamond films. Cyclic
Voltammogams were recorded with a number of well known redox couples to show
the behaviour of the films.
·
The
effect of surface termination of the electrode was investigated.
·
AC
Impedance and Mott-Schottky plots are presented.
·
The
results of the electrochemical experiments are explained in terms of the theory
outlined in chapters 4 and 7.
5.1 Experimental Set-up
Electrochemical experiments
were performed using a three electrode system. This section describes the
apparatus used.
5.1.1 Electrolyte Solutions
Aqueous solutions were made
up with 18.3 MW cm ultrapure deionised water (Millipore).
Standard laboratory grade reagents were used to make up
the background electrolytes. Appendix A contains details of the stated maximum
levels of impurities.
Glassware was cleaned with a four
step process:
1.
soaking
in a base bath
[saturated sodium hydroxide (NaOH) in ethanol(C2H5OH)];
2.
immersing
and rinsing in deionised water;
3.
soaking
in an acid bath
[2.5 dm-3 nitric acid (HNO3) to 10 dm-3 water
(H2O)].
4.
immersing
and rinsing in deionised water.
Dissolved oxygen (O2)
was removed from the electrolyte solutions by purging the liquid with standard
laboratory grade oxygen-free nitrogen (N2) for at least 30 minutes.
5.1.2 Electrochemical Cells
The main type of cell used
in these studies was a single chamber design. A schematic diagram is shown in
figure 5.1. This cell design proved ideal for performing electrochemistry with
silver dag, TLM and TiUL contacts.
The electrochemical cells
were fabricated from white cylinders of PTFE †
(50 mm in diameter). A central bore was removed from the main segment of
the cell to provide a reservoir for the electrolyte. The diamond sample that
was to be used as a working electrode (WE) was laid horizontally and sandwiched
between two PTFE cylinders. A 3mm hole in the base of the main piece and an ‘O’
ring (3 mm internal diameter) exposed a selected area of the electrode
surface to the electrolyte. Therefore, the approximate electrode area exposed
the electrolyte was 0.07 cm2 (7 mm2).
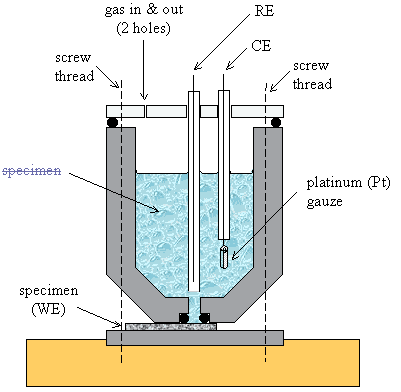
Figure 5.1 – A schematic
diagram of an electrochemistry cell
The base of the cell was
tapered to allow small samples to be used. All samples had to be flat and the
minimum sample size was 15 mm ´ 5 mm. Typical sample
dimensions were 15 mm ´ 10 mm.
The bottom piece of PTFE was
attached to a brass plate to provide a stable base.
A transparent top piece was
fitted over the cell. The reference electrode (RE) and the counter electrode
(CE) were placed through holes in the top. They were held in place by rubber
rings (not illustrated in figure 5.1). Two additional holes allowed for
deoxygenating to be performed. Nitrogen could be bubbled through the
electrolyte via a needle that was passed down into the solution.
Control experiments could be
performed with platinum (Pt) working electrodes. Platinum wires could be passed
down through one of the gas holes.
Optical experiments were
performed by removing the lid of the vessel. The reference and counter
electrodes were then clamped in place and the sample was illuminated from
above, through a minimum depth of electrolyte.
Early experiments performed
with indium/gallium (In/Ga) eutectic contacts to the silicon substrate were
performed in a three compartment glass cell. The sample was attached to a steel
strip and covered with adhesive PTFE tape. This provided a temporary waterproof
cover over the electrode. A circular hole with a diameter of 5 mm was punched
into the PTFE tape so as to expose an area of approximately 80 mm2
of the electrode surface. This working electrode was placed in the central chamber.
A reference electrode was placed in a side compartment which was connected to
the central chamber through a Luggin capillary tip. A counter electrode was
placed in the other side compartment which was connected to the main chamber
through a glass frit.
5.1.3 Reference Electrodes
Silver | silver chloride
(Ag | AgCl) reference electrodes were used (BAS [Bioanalytical
Systems, Inc.] and CH Instruments, Inc.). These electrodes comprised of a
silver chloride coated silver wire in a glass tube with a porous polymer tip (Vycor frit). The glass tube formed an
electrode compartment which was filled with 3 mol dm-1 potassium
chloride (KCl) or sodium chloride (NaCl).†
A diagram of a reference electrode is shown in figure 5.2.
The standard potential, E0, for the
Ag | AgCl redox couple at 25 ºC is
+ 0.22239 ± 0.00005 V relative to the normal hydrogen electrode (NHE). 127-128
The redox potential for the reference electrode, E, is dependant on the concentration of chloride ions in the
electrode compartment. The Nernst equation for the Ag|AgCl electrode can be
represented as:
![]() where g = activity coefficient for the solution
where g = activity coefficient for the solution
[Cl-] = concentration of Cl- ions
This gave a redox potential
for the reference electrode of + 0.194 V vs.
NHE at 25 ºC.
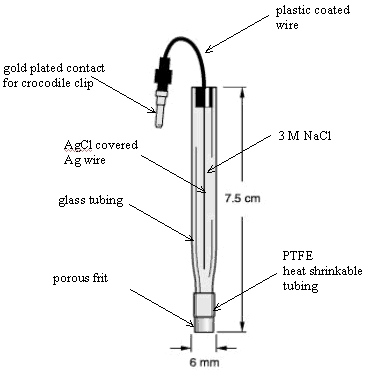
Figure 5.2 (top) – A
schematic diagram of a Ag | AgCl reference electrode
(adapted from BAS sales
literature)
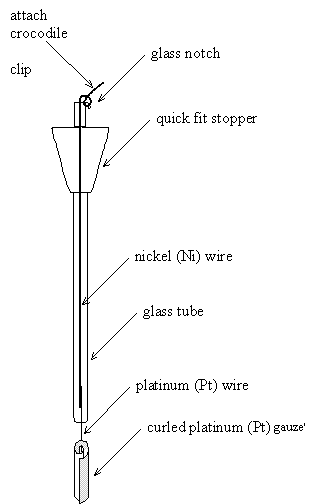
Figure 5.3 (bottom) – A schematic diagram of a platinum counter electrode
5.1.4 Counter Electrodes
Platinum (Pt) counter
electrodes were made from a curled square of platinum mesh attached to a platinum
wire. This provided a suitably large surface area. A glass tube was used to
hold the electrode. This was designed with the same diameter as the reference
electrode. The tube was sealed to the platinum wire at the bottom of the
electrode. The top of the tube, which was never submersed into the electrolyte,
was left open. This allowed for repairs to be made to the electrode if the
seals or joins became damaged. Nickel wire was used inside the glass tube
because it was less expensive than the platinum wire. The wire was wound round
a notch at the top of the electrode, so that the weight of the attached
crocodile clip did not apply a force on to the platinum-nickel join or the
platinum-glass seal. A quick fit stopper was fitted to the top of the electrode
provide compatibility with a number of other designs of electrochemical cell. A
diagram of a counter electrode is shown in figure 5.3.
5.1.5 Potentiostats
Cyclic voltammograms were
recorded with a computer controlled E-Chemie m‑Autolab potentiostat.
A Solartron 1286 potentiostat and a Solartron 1250
Frequency Response Analyser (FRA) were used to take AC impedance measurements.
The experiments were controlled and the results captured with the ZPlot/ZView
and CorrWare/CorrView software packages.
IMPS studies were performed
with the Solartron FRA and a potentiostat that was built in-house by the
electronics workshop. The in-house potentiostat was designed to prevent phase
shifting of the signal over a wide range of frequencies.
5.1.6 Faraday Cages
Experiments were performed
in Faraday Cages. The cages were fabricated in-house by the mechanical
workshop. They were welded together from sheet steel and painted black. The
boxes measured approximately 1 m (height) ´ 1 m (width) ´ 1 m (depth). The front panel incorporated a
large hinged door.
The Faraday Cages isolated
the experiments from electromagnetic interference and external sources of
light.
5.2 The Cyclic Voltammetry
Technique
Cyclic voltammetry is a
technique which can be used to study the electrode kinetics of a redox couple
in a three electrode system.
The potential of the working
electrode is swept between two set potentials. The scan rate (the magnitude of
the rate of change of the applied potential with time) is kept constant.
As the applied potential is
increased, oxidation will occur and a positive current will flow (electron
transfer from the species being oxidised to the electrode). Conversely, as the
potential is decreased, reduction will occur and a negative current will flow
(electron transfer form the electrode to the species being reduced).
5.2.1
Reversible Electrode
Dynamics
Reversible electrode
dynamics are exhibited in systems where the heterogeneous rate constants are
large. Reactions will start to occur as soon as the potential is such that they
are thermodynamically viable. As both the forward and back reactions are rapid,
the concentrations of the reduced and oxidised species will be effectively
maintained at the ratio predicted by the Nernst equation. The resulting cyclic
voltammogram will exhibit the following features. 120
·
The
scans will be symmetrical.
·
The
potentials at which the peaks occur will be independent of scan rate.
·
The
peak separation will be approximately equal to (59 ´ n) mV
at 25 °C where n equals the
number of electrons transferred in the reaction.
·
The
peak height will vary as the square root of the scan rate.
5.2.2 Irreversible Electrode
Dynamics
A system which exhibits
irreversible electrode dynamics will produce a cyclic voltammogram with
different characteristics to those produced by a reversible system.
The onset of the reaction
will not occur at potentials immediately beyond the equilibrium potential. An
appreciable overpotential will be required to induce the reaction as it is not
kinetically favourable.
As the overpotential is
increased, the homogeneous rate constant increases and the rate of reaction
will rise. This will be countered by the depletion of the reactant at the
surface of the electrode. The position of the peak maximum reflects the balance
between the increasing heterogeneous rate equation and the decrease in the
surface concentration of the reactant. The current is controlled by the
electrode kinetics up to the peak maximum. After the peak maximum, the current
simply reflects the rate at which the reactant diffuses though the solution to
the surface of the electrode.
Irreversible systems are not
kept at equilibrium and the back reaction is negligible.
A cyclic voltammogram for an
irreversible system will exhibit the following features. 120
·
The
peak separation will be wider than the (59 ´ n) mV at 25 °C seen for reversible systems.
·
The
peak separation will increase with scan rate.
·
Irrespective
of the electrode dynamics, the peak height will vary as the square root of the
scan rate.
5.2.3 Quasi-Reversible
Electrode Dynamics
Reversible electrode
behaviour is the limiting case when the electrode kinetics are fast relative to
the mass transport conditions. Conversely, irreversible electrode behaviour is
the limiting case when the electrode kinetics are slow relative to the mass
transport conditions. Intermediate cases exist where the surface concentrations
of the reduced and oxidised species depend on both the electron transfer rates
(forward and reverse) and the rate of mass transport. These cases are said to
exhibit quasi-reversible behaviour.
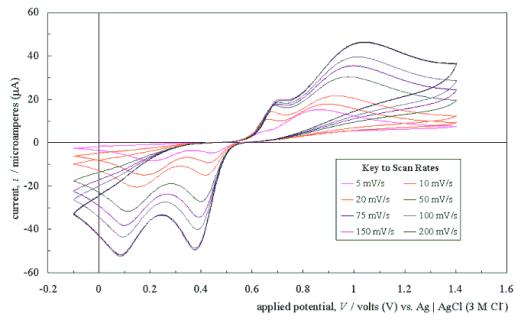
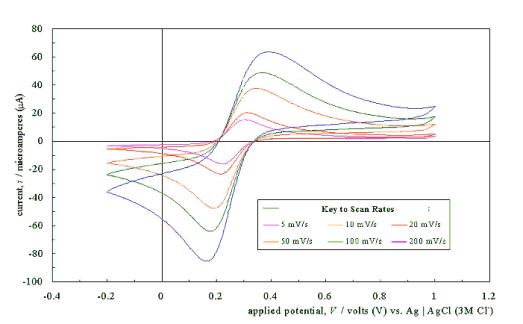
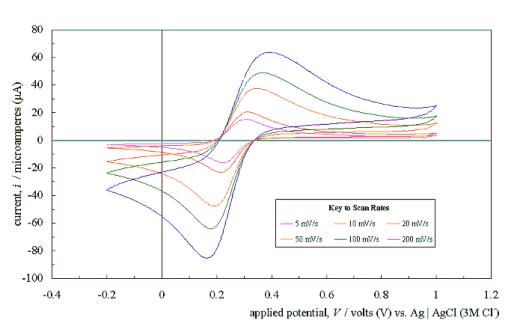
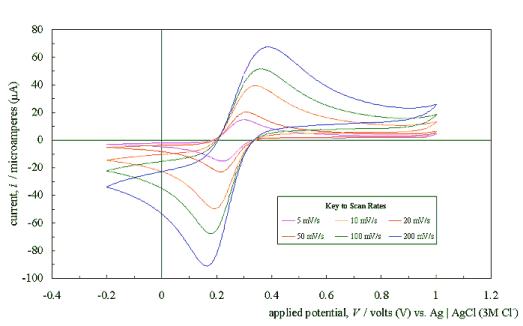
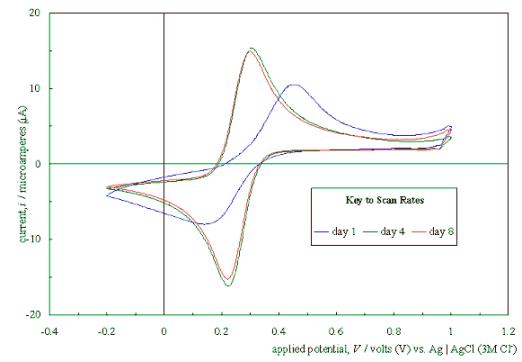
5.3 Cyclic Voltammetry in
Dilute Nitric Acid
Cyclic voltammograms were
recorded in an aqueous solution containing 1 mol dm-3 nitric acid (HNO3) and 2 mol
dm-3 sodium chloride (NaCl).
A highly doped diamond film
used as a working electrode (sample B67, doping level 5 ´ 1021 cm-3, silver dag
contact). † Before use, the diamond
film was refluxed in concentrated nitric acid in order to reduce the presence
of any non-diamond carbon. Electrical contacts were then made to the top of the
film using silver dag.
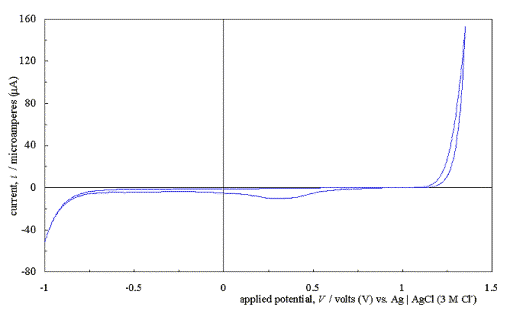
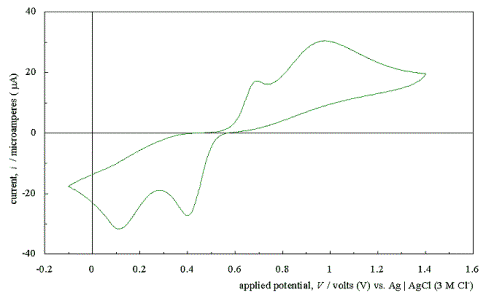
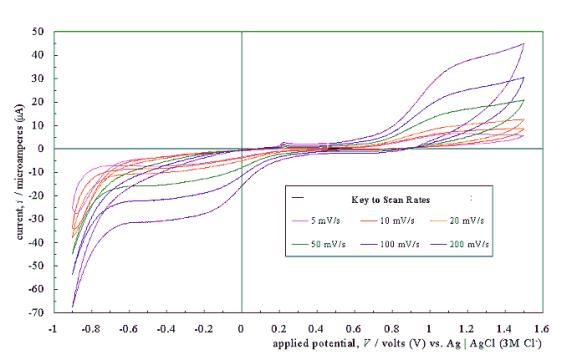
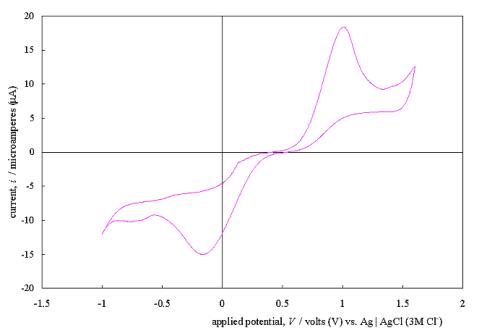
Figure 5.4 shows a typical
cyclic voltammogram recorded at a scan rate of 50 mVs-1. The
scan shows that the electrode has a wide potential window, with no significant
solvent breakdown occurring in a range from –0.7 V to 1.1 V with respect to the
Ag | AgCl (3 M Cl-) reference electrode. This window was
significantly wider than those reported for many commonly used electrode
materials.