Chapter 8
Intensity Modulated Photocurrent Spectroscopy
8.0 Outline
·
This
chapter presents the results of Intensity Modulated Photocurrent Spectroscopy
(IMPS) experiments on boron doped diamond films.
·
A
theory is presented to explain the results.
8.1 Intensity Modulated
Photocurrent Spectroscopy (IMPS)
IMPS is electrochemical
technique where the working electrode is illuminated by a sinusoidally
modulated source. 135 An AC photocurrent may be generated by the
fluctuating level of illumination. The harmonic response of the photocurrent to
the illumination may be phase shifted. This photocurrent may be analysed as a
function of the modulation frequency of the light source.
It has been shown that IMPS
can provide information about charge transfer 136 and recombination 137
at the illuminated semiconductor-electrolyte junction.
8.2 Experimental Set-up
A Solartron 1250 Frequency
Response Analyser (FRA) was used to generate a sinusoidally oscillating
potential. This was used to drive a light emitting diode (LED). The potential
had a DC component of 4.5 V and an AC component of ±0.5 V. The ‘turn on’ potential of the LED was
approximately 3 V. At the potentials used, the intensity of the light
produced by the LED was linear with respect to the applied potential.
Therefore, the electrochemical cell was constantly illuminated and the light
had a fluctuating component which was sinusoidal and in phase with the driving
AC potential.
A custom built potentiostat
was used which was known not to apply a phase shift to the signal. The applied
DC potential between the working electrode and the reference electrode was
fixed while the frequency of the light oscillation was varied. The circuitry in
the potentiostat was able to accurately record signals fluctuating at frequencies
up to 2000 Hz.
The potentiostat signal was
fed into the FRA. The FRA measured the harmonic component of the signal. The
quotient of this harmonic current to the harmonic component of the driving
signal was then recorded as a function of the harmonic frequency. As the
harmonic current was phase shifted from the harmonic light intensity, the
resulting quotient was complex. A bode plot of the quotient could therefore be
plotted.
IMPS experiments require a
monochromic light source with a controllable and variable intensity. Lasers or LEDs are commonly used to provide
the light. In these studies two LEDs were used. One LED emitted light at a
wavelength of 470 nm. The other LED emitted 430 nm light. The 470 nm
LED was more efficient and produced a more intense light beam than the 430 nm
LED.
The data were recorded with Z-plot software and viewed with Z-view 2 software (Scribner Associates, Inc.). The Z-view 2 software enabled curves to be fitted to IMPS curves. Values could therefore be found for the frequencies at which the maxima of the IMPS curves occurred.
Figure 8.1 shows a schematic
diagram of the IMPS set-up.
Figure 8.1
The IMPS Set-up
8.3 Experimental Results
Sample B121a was grown in a
hydrogen/methane/diborane atmosphere with a [B]/[C] ratio of 254 p.p.m. in the
gas phase (corresponding to a boron doping level of 4 ´ 1019 cm-1).
Figures 8.2 to 8.7 show IMPS
plots for B121a, which were recorded with a minimum depth of electrolyte.
Details of the aqueous solutions and wavelength of the illuminating LED used
are listed in table 8.1. The frequency of the AC component of the illumination
was varied from 1 Hz to 4000 Hz.
|
Figure |
Solution |
LED wavelength, lLED (nm) |
|
8.2 |
A (equimolar Fe2+
& Fe3+) |
470 |
|
8.3 |
A (equimolar Fe2+
& Fe3+)A |
430 |
|
8.4 |
B (Fe2+) |
470 |
|
8.5 |
B (Fe2+) |
430 |
|
8.6 |
C (Fe3+) |
470 |
|
8.7 |
C (Fe3+) |
430 |
Table 8.1
Summary of IMPS experimental conditions
Solution A was an aqueous
solution of
0.5 mol dm-3
H2SO4, 1 ´ 10-3 mol dm-1
FeSO4 and 5 ´ 10-4 mol dm-1
Fe2(SO4)3.
Solution B was an aqueous
solution of
0.5 mol dm-3
H2SO4 and 1 ´ 10-3 mol dm-1
FeSO4.
Solution C was an aqueous
solution of
0.5 mol dm-3
H2SO4 and 5 ´ 10-4 mol dm-1
Fe2(SO4)3.
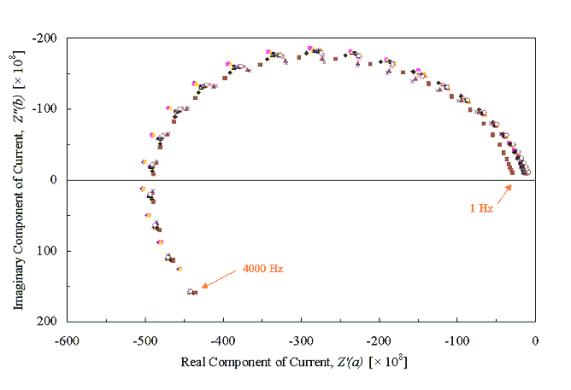
Figure 8.2 – Diamond Sample B121a, I.M.P.S. @ 470 nm, 1 mM Fe2+, 1 mM Fe3+, 1 M H+ various applied DC potentials, frequency range 1 Hz – 4000 Hz
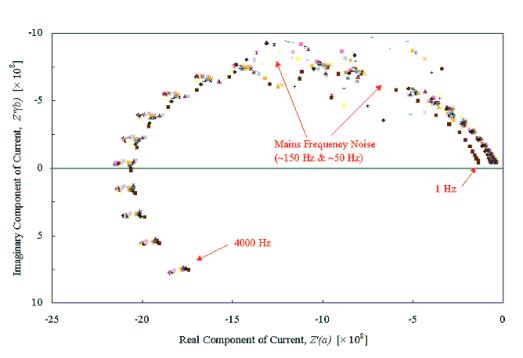
Figure 8.3 – Diamond Sample B121a, I.M.P.S. @ 430 nm, 1 mM Fe2+, 1 mM Fe3+, 1 M H+ various applied DC potentials, frequency range 1 Hz – 4000 Hz
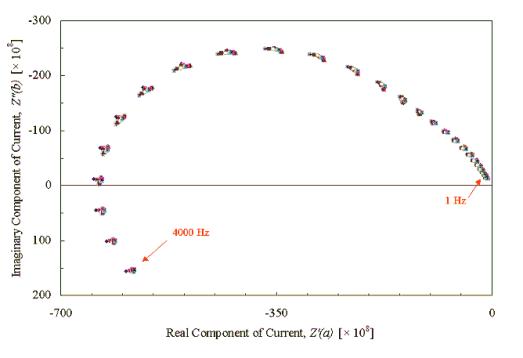
Figure 8.4 – Diamond Sample B121a, I.M.P.S. @ 470 nm, 1 mM Fe2+, 1 M H+
various applied DC
potentials, frequency range 1 Hz – 4000 Hz
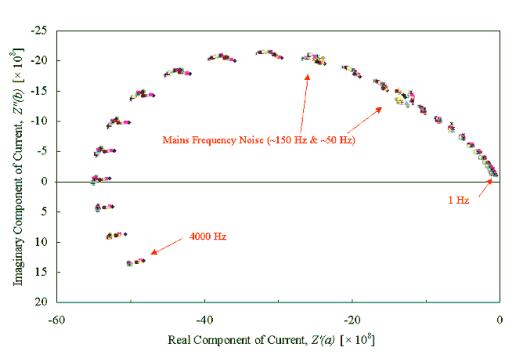
Figure 8.5 – Diamond Sample B121a, I.M.P.S. @ 430 nm, 1 mM Fe2+, 1 M H+
various applied DC
potentials, frequency range 1 Hz – 4000 Hz
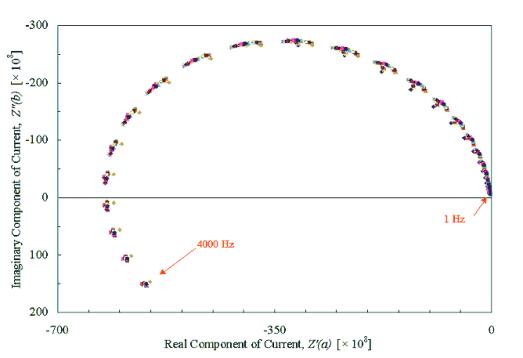
Figure 8.6 – Diamond Sample B121a, I.M.P.S. @ 470 nm, 1 mM Fe3+, 1 M H+ various applied DC potentials, frequency range 1 Hz – 4000 Hz
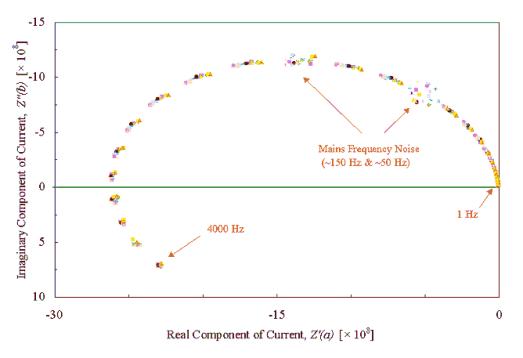
Figure 8.7 – Diamond Sample B121a, I.M.P.S. @ 430 nm, 1 mM Fe3+, 1 M H+
various applied DC potentials, frequency range 1 Hz – 4000 Hz
Table 8.2 – Key to DC voltages in
Figure 8.2 Fe2+/Fe3+
470 nm
Table 8.3 – Key to DC voltages in
Figure 8.3 Fe2+/Fe3+ 430 nm
Table 8.4 – Key to DC voltages in
Figure 8.4 Fe2 + 470 nm
Table 8.5 – Key to DC voltages in
Figure 8.5 e2 + 430 nm
Table 8.6 – Key to DC voltages in
Figure 8.6 Fe3+ 470 nm
Table 8.7 – Key to DC voltages in
Figure 8.7 Fe3+ 430 nm
It can be seen that the wmax was found to be independent
of the applied DC potential.
Table 8.8 below summarises
the results for the above experiments. The value of wmax was averaged for the scans
recorded with applied DC potentials between 0.40 V and 0.52 V vs. Ag|AgCl (3 M
Cl-) inclusive.
|
Solution |
lLED (nm) |
wmax (rad s‑1) |
st. dev. |
|
A (equimolar Fe2+
& Fe3+) |
470 |
827 |
20 |
|
A (equimolar Fe2+
& Fe3+) |
430 |
745 |
241 |
|
B (Fe2+) |
470 |
1358 |
51 |
|
B (Fe2+) |
430 |
1301 |
54 |
|
C (Fe3+) |
470 |
962 |
50 |
|
C (Fe3+) |
430 |
921 |
50 |
Table 8.8 frequencies of IMPS maxima for several experimental conditions
Figures 8.8 and 8.9 show
graphs comparing the results for the IMPS experiments taken with an applied DC
voltage of 0.46 V vs. Ag|AgCl (3 M Cl-). This corresponded to the open circuit potential as determined by
the mAutolab
and Solartron potentiostats.
The high frequency sections
of the plots that cross the origin can be disregarded as artefacts of the
potentiostat circuitry, which was considered to be unreliable above a frequency
of approximately 2 kHz
The scans showed IMPS
signals that tended to zero at high and low frequencies. These results are
unusual and can be explained by the surface state model that has been developed
for boron doped diamond electrodes.
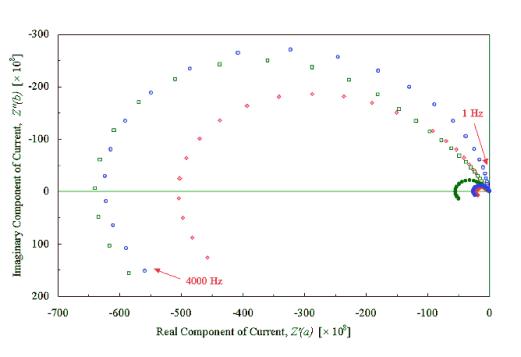
Figure 8.8 – Diamond Sample B121a, I.M.P.S. @ 470 nm & 430 nm
applied DC potentials = 0.46 V (near OCP), frequency range 1 Hz – 4000 Hz
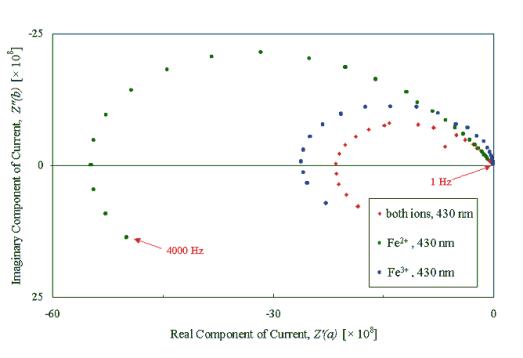
Figure 8.9 – Diamond Sample B121a, I.M.P.S. @ 430 nm applied DC potentials = 0.46 V (near OCP), frequency range 1 Hz – 4000 Hz
The IMPS results were
independent of the applied DC potential.
The values of wmax were not effected by the
excitation wavelength. The magnitude of the signals were smaller for the 430 nm
experiments due to the reduced intensity of the illumination.
The two excitation
wavelengths used were 430 nm and 470 nm. These corresponded to energies of 2.88
eV and 2.64 eV respectively. Therefore, a photocurrent was being produced by
illumination with sub-bandgap radiation. This suggested that a photoexcited
surface state was involved.
The magnitude of the
responses for the different aqueous solutions are not indicative as the
coloured solutions absorbed some of the light as it passed through the cell.
Therefore, the transmission through different solutions varied and no
compensation was made for this effect.
8.4
Theory
8.4.1 Effect of Constant Illumination on the Current Density
If it is assumed that illumination may cause direct excitation of valence band electrons to a surface state, then a photocurrent may be generated. Figure 8.10 shows the effect of illumination on a system that is forward biased relative to the flat band potential.
Figure 8.10 photogenerated electrons at the diamond-electrolyte interface
Photogenerated electrons
flow to surface states while the photogenerated holes flow into the bulk. Flow
of electrons from the redox couple to the surface state will be driven by the
potential drop across the Helmholtz layer, dVH. Flow of electrons from
surface states into the bulk will be driven by the potential drop across the
space charge region, dVSC.
Considering the system in the dark as a reference and assuming no significant recombination of photogenerated electrons and holes, a series of equations can be derived for the system.
The general equation for the
current density across Helmholtz current, jH,
(equation 4.8) is:
![]() (equation
8.1)
(equation
8.1)
The semiconductor / surface state
junction treated as a Schottky-diode
(adapted from equation 4.18):
 (equation 8.2)
where gI is the current across the
space charge region due to illumination.
gI corresponds to the product of the charge on an electron and the number of photons absorbed per second per unit area. gI may also been considered to be the rate of generation of surface state charge caused by illumination.
Kirchoff’s first law still
applies and the consideration of equivalent circuits in section 6.3 can be
easily adapted to include the term gI. The effect of illumination alters the jsc term but the other terms
are unaffected.
Equation 7.8:
![]() (equation
8.3)
(equation
8.3)
where
dV is
the applied potential relative to open circuit in the dark
Equation 7.9:
![]() (equation
8.4)
(equation
8.4)
This leads to a version of
equation 7.16 for the case where g = 1. This gives an expression relating the
DC current under illumination to the potential.
jI is the total current density when the system is illuminated (i.e. the
sum of the current density in the dark and the photcurrent density).
(equation
8.5)
Figure 8.11 shows a Mathcad
plot of equation 7.16 (dark) and equation 8.5 (illuminated). A value for gI
of 1 ´ 10-2 A cm-2 was used.
This is high value and it should be noted that high levels of illumination are
required to generate a significant change in the j-V curve. It can also be
seen that there is a shift in the open circuit potential when the system is
illuminated.
A series of experiments were
performed where diamond samples were exposed to bright broad-spectrum (white)
light. Conclusive results were not
obtained intense illumination heated the electrolyte solution and this would
also have altered the measured current.
Figure 8.11 Mathcad plots of
equations 7.16 (dark) and 8.5 (illuminated)
8.4.2 Effect of Modulated Illumination on the Current Density
Adapting the AC impedance
model developed in section 6.4 to incorporate the current density due to a
modulated intensity of illumination (![]() ).
).
Equation 7.22 states that:
![]() (equation
8.6)
(equation
8.6)
When the system is under potentiostatic control:
![]() (equation
8.7)
(equation
8.7)
The current across the Helmholtz layer is given by
equation 7.26:
![]() (equation
8.8)
(equation
8.8)
Adapting equation 7.28 for a
photocurrent density gave:
![]() (equation 8.9)
(equation 8.9)
where jI is the DC current flowing while the system is under
illumination.
Equation 7.29 can be adapted
to incorporate ![]() and
and ![]() :
:
(equation
8.10)
The term j0,SC is defined as the open
circuit potential in the dark and dV
is the applied potential relative to j0,SC.
As the modulations are
small, equation 8.10 can be expanded using Taylor’s theorem.
(equation
8.11)
Equation 8.11 may be
rewritten to give:
![]() (equation
8.12)
(equation
8.12)
where 
(equation
8.13)
Applying Kirchoff’s first law to the equivalent
circuit gives equations 7.37 and 7.38.
![]() (equation
8.14)
(equation
8.14)
![]() (equation
8.15)
(equation
8.15)
The above equations may be combined to give an
equation for the IMPS signal:
 (equation
8.16)
(equation
8.16)
Equation 8.16 is a single
semicircle which goes to zero at high and low frequencies. This in line with
the experimental results presented in section 8.3.
Figure 8.12 shows a Mathcad
plot of equation 8.16.
Figure 8.12 - Mathcad plot of IMPS equation 8.16
8.5 Summary
IMPS results have been
obtained for boron doped ploycrystalline diamond electrodes. Values for wmax have been obtained for the
Fe2+/3+ redox couple. The values of wmax are independent of DC
potential and the choice of excitation wavelength (470 nm or 430 nm).
The surface state model
developed for the AC impedance of the diamond electrodes has been extended to
cover intensity modulated photocurrents.
The results suggest that
charge transfer occurs via a surface state.