Chapter 3 - Experimental
3.1 Introduction
A hot filament chemical
vapour deposition chamber has been used to deposit diamond films onto silicon
(100) substrates using a variety of input source gases, under standard
deposition conditions (See Table 3.1).
The resulting films were examined using a variety of analytical
techniques (See Chapter 2), (1) Auger Electron Spectroscopy (AES) to measure
the dopant concentrations in the diamond films, (2) Laser Raman Spectroscopy
(LRS) to analyze the quality of the films, namely their sp2-to-sp3
ratios and, (3) Scanning Electron Microscopy (SEM) to examine the film surface
morphology, thickness and growth rates.
| Pressure | 20 Torr |
| Gases | C/H,C/H/Cl, C/H/N and C/H/P systems |
| Total gas flow rate | 100 or 200 sccm |
| Substrate temperature | 800-1000°C (typically 900°C) |
| Filament temperature | 2300-2400°C (filament current 6½-6¾A) |
| Filament/substrate distance | 4 mm |
| Deposition time | 6 hours |
Table 3.1. Standard deposition conditions employed in a hot filament CVD
reactor.
Molecular beam mass spectrometry has been used to investigate the behaviour of different input source gas mixtures (Table 3.2) as diamond growth precursors in the hot filament CVD reactor, and to identify and understand the gas phase and gas-solid reaction mechanisms in the CVD process, and the changes in the reactions which occur in the presence of these different dopant gases. Later in this chapter we describe the hot filament CVD apparatus (section 3.2), the molecular beam mass spectrometer design (section 3.3 and 3.4), its characterization, data collection and reduction (section 3.5) and a step-by-step explanation of the procedure used to calculate species concentrations from raw molecular beam mass spectrometric (MBMS) data (section 3.6).
Photograph of the Hot Filament Reactor.
3.2 Hot filament CVD reactor
The deposition chamber is a standard HFCVD reactor consisting of a stainless steel six-way cross (Figures 3.1 and 3.2). One of the flanges incorporates a glass window for viewing the substrate and filament and through which the pyrometer measures the filament temperature. This window becomes coated with a yellowy-brown deposit after several deposition runs, which can be removed by cleaning with an IPA-soaked cloth. Of the other five flanges, one is blank, one connects to the pump, one is attached to the moveable filament/substrate assembly, one is attached to the mass spectrometer, and the final one has feedthroughs for the gas inlet and pressure gauge. This section is now split into 4 sub-sections to describe the CVD set-up in more detail. They include the filament, the substrate, gas phase composition, and gas flow system.
(a) The filament
The
CVD reactor employs a 0.25 mm thick tantalum filament which is prepared by
winding a length of the wire into a coil with a diameter of ~4 mm and length ~1 cm.
Six turns of the wire is the standard used in all deposition experiments
as well as molecular beam mass spectrometric studies. The tantalum wire
filament is connected to a Variac power source and is heated to ~2300°C (achieved by passing a
current of 6½-6¾ A through the filament) during film growth. This provides the necessary energy to cause
dissociation of the process gases. A
two-colour optical pyrometer (Land Infrared), placed in front of the glass
window, is used to measure the filament temperature during diamond
deposition. Four cooling fans are
positioned around the chamber to dissipate the heat produced by the filament
during growth as well as during product distribution measurements.
(b) The substrate
Films
were grown exclusively on silicon (100) substrates that had been pre-treated to
enhance nucleation. Pre-treatment
involves manually abrading the smooth silicon surface with 1-3 mm diamond powder prior to deposition. This is achieved by placing the substrate on
a suitable surface (a ceramic tile), sandwiching a small amount of diamond
powder (a cluster of diameter ca.
1-2 mm) between its surface and a grinding pad (usually another piece of
silicon placed upside down) and rotating the grinding pad applying a gentle
uniform pressure. A well abraded
substrate usually requires no more than 30 seconds of this procedure. The substrate is then cleaned with IPA to
remove all remaining diamond grit present on the surface.
The substrate is then placed onto the substrate holder and positioned carefully under the filament to ensure even diamond growth. Heat is supplied to the substrate by a coiled resistive wire which is protected by ceramic beads and embedded in the cement of the substrate holder. The substrate heater temperature is controlled by an Iso-Tech D.C. power supply. The maximum recommended voltage that should be applied to the heater without causing damage is 5 volts. This produces a current flow of ~5A across the resistive wire, and a resultant substrate temperature of ~300-400°C. The additional heating required to attain the optimum substrate temperature of 900°C is achieved from the heated filament (2300°C) 4 mm above the substrate surface. A K-type thermocouple in direct contact with the substrate surface is employed to measure the temperature of the substrate during deposition. The filament/substrate set-up is shown in Figure 3.3.
(c) Gas phase composition
The
gas composition used in standard growth conditions is a 1% CH4/H2
mixture. Other C/H containing precursor
gases have been examined3.1,3.2 to study the effects on different
hydrocarbons on the gas phase chemistry of the CVD process, and this will be
discussed in detail in Chapter 4. In
Chapter 5, we replace methane gas with (1) a range of different halomethanes,
namely CH4-nCln (n=1-4) in H2, taking care to always maintain a
carbon-to-H2 ratio of 1:100 in the gas mixture, and (2) a gas
mixture containing 1% CH4 in Cl2/H2, the
amount of chlorine varying from 1% to 4% (2-8 atom %). In Chapter 6 we examine the effects of
nitrogen on the CVD process by substituting methane with a variety of C- and/or
N-containing precursor gases, and in the final Results chapter (Chapter 7), we
investigate the effects of adding phosphine on the growth behaviour of diamond
films, using gas mixtures of 1% CH4 with varying amounts of PH3
(1000-5000 ppm). A summary of the input
source gases used is shown in Table 3.2.
|
Chapter # |
Input source gases used |
Chemical Formula |
Performed deposition runs on |
Performed MBMS analysis on |
|
4 |
Methane Ethane Ethylene Acetylene n-Butane 1,3-Butadiene |
CH4 C2H63.2 C2H43.2 C2H23.2 n-C4H103.2 C4H63.2 |
ü |
ü ü |
|
5 |
Chloromethane Dichloromethane Trichloromethane Tetrachloromethane Tetrafluoromethane Hydrogen chloride Chlorine (molecule) |
CH3Cl CH2Cl2 CHCl3 CCl4 CF4 Cl2 |
ü ü ü ü ü ü |
ü ü ü ü ü calibration only ü |
|
6 |
Ammonia Methylamine Hydrogen Cyanide Nitrogen (molecule) |
NH3 CH3NH2 HCN N2 |
ü ü ü ü |
ü ü ü ü |
|
7 |
Phosphine |
PH3 |
ü |
ü |
Table 3.2. Summary of the input gases
used in the present work (except those taken from Reference 3.2). Details of
the deposition results (including scanning electron micrographs (SEMs) of the
films grown) and MBMS analyses will be discussed in full detail in their
respective chapters in the Results section.
(d) Gas flow system
The gas flow system incorporated in the hot filament CVD set-up is shown in Figure 3.4. The gases are stored in various vessels (See Table 3.3): gas cylinders, lecture bottles and glass bulbs (gas or liquid sources). The gases then flow through calibrated mass flow controllers (MFCs - Tylan General), after which they mix in a manifold and then join the main feed pipe leading to the top of the chamber. A two-stage rotary vacuum pump draws gases through an outlet at the bottom of the chamber. Both coarse (speedivalve) and fine (needle) valves are incorporated into the pump manifold enabling pressure adjustments in the reaction chamber. There is also an air inlet to vent the chamber up to atmospheric pressure for filament/substrate replacements. A direct measure of the process pressure, which is maintained at 20 Torr during the film growth, is made with a capacitance diaphragm gauge (Baratron).
Gas Conversion Factors
Mass flow controllers (MFCs) are calibrated by
referencing them to a standard (N2 in this case) while gas is
flowing. Because the MFC responds
differently to gases other than the reference gas, a Gas Conversion Factor
(GCF) is required.3.3 The
gas conversion factors listed below are relative to N2 since all the
mass flow controllers used (except for the ammonia MFC used only for NH3)
are nitrogen MFC’s. This conversion
allows us to determine the actual flow rates of the different gases passing
through the mass flow controllers.
|
Input gas |
Gas Source |
Regulator used |
MFC type |
GCF3.3 |
Set flow rates for 1 sccm of gas |
|
H2 CH4 C2H63.2 C2H43.2 C2H23.2 n-C4H103.2 C4H63.2 |
SGC SGC LB LB SGC LB LB |
B B B B B B B |
a a a a a a a |
1.01 0.72 0.50 0.60 0.58 0.26 0.32 |
0.99 1.39 2.00 1.67 1.72 3.85 3.13 |
|
CH3Cl (l) CH2Cl2
(l) CHCl3 (l) CCl4 (l) CF4 HCl Cl2 |
LB GB GB GB LB LB LB |
N N N N B SSP SSP |
a a a a a b b |
0.63 0.51 0.39 0.31 0.42 1.00 0.86 |
1.59 1.96 2.56 3.23 2.38 1.00 1.16 |
|
NH3 (l) CH3NH2
(l) HCN N2 |
LB LB GB SGC |
P N N B |
c c a a |
0.74* 0.51 0.76 1.00 |
1.35 1.96 1.32 1.00 |
|
PH3 |
LB |
SS |
b |
0.76 |
1.32 |
Table 3.3., Detailed information on
gas sources used, mass flow controller type and regulators required, together
with characteristic gas conversion factors and flow rates.
___________________________________________________________________
Gas source:
(l) = liquid source - uses the vapour pressure of
the volatile liquid.
SGC = standard gas cylinder, 2000 psi input
pressure, 20 psi output pressure (BOC).
LB = lecture bottle, maximum output pressure of 20 psi (Argo International Ltd).
GB = glass bulb, used for gases or liquid
sources. Pressures are low (typically
< 1 atm ) therefore no regulators required.
Regulator used:
B = brass, SS = stainless steel, SSP = stainless
steel with facility for purging with N2 or Argon, N = none, P =
plastic regulator used with maximum output pressure of 2-6 psi (Matheson Gas
Prod.).
MFC type:
a = nitrogen FC 260 viton MFC (Tylan General).
b = nitrogen FC 260 kalrez MFC (Tylan General).
c = ammonia FC 260 neoprene MFC (Tylan General).
GCF = Gas Conversion Factor
relative to nitrogen gas (N2).
* NH3 mass flow controller used, \ GCF and gas flow rate = 1.
sccm = standard cubic centimetres per minute (cm3/min).
___________________________________________________________________
Safety
Precautions and handling information
Some of the gases used in the present work require special attention on safety precautions and handling procedures, and these are summarised below in Table 3.4.
|
Special Gases |
Safety information and appropriate handling procedures. |
|
HCl |
Corrosive - blocks up MFC, and therefore requires a purged regulator and a
special MFC for corrosive gases (N2 FC 260 kalrez). The CVD chamber and MFC must be thoroughly
pumped before venting the reactor to atmosphere for filament/substrate
replacements. |
|
Cl2 |
Corrosive - reacts with moisture to produce HCl which again can block up the
MFC. This gas also requires a purged regulator and a special MFC for
corrosive gases (N2 FC 260 kalrez). |
|
NH3 |
Toxic and pungent - make sure laboratory is well ventilated. An ammonia MFC is used,
and a special plastic regulator is incorporated. |
|
CH3NH2 |
Blocks up MFC very easily.
The MFC must be flushed frequently with N2 or argon before re-use. |
|
HCN |
Highly toxic - make sure laboratory is well ventilated and that there is an
antidote kit ready if exposed to the gas. |
|
PH3 |
Highly toxic - The CVD chamber and MFC must be thoroughly pumped. Pyrolysis of PH3 results in the
coating of large amounts of red phosphorus on the CVD chamber walls which
requires regular cleaning. |
Table 3.4. Safety precautions and
general awareness of the hazardous gases that have been used in the present
work.
3.3 Molecular beam mass
spectrometry of diamond CVD
Identifying
and understanding both the chemical reactions and the physical transport
mechanisms that contribute to the CVD process requires an in-situ diagnostic technique that permits quantitative
determination of the concentrations of both free radical and stable species in
the gas-phase, with minimal perturbation of the process environment. Optical spectroscopy3.4 is a
widely used technique, but is generally specific to a particular target
species. Gas chromatography3.5,3.6
and mass spectrometric3.7-3.10 studies have the advantages of
generality and the fact that many stable species can be analyzed
simultaneously, though recombination in the probe used to sample the process
gas in these studies precludes detection of reactive gas species. However, with careful design of the gas
sampling system, mass spectrometry can be used to detect free radicals. Molecular Beam Mass Spectrometry (MBMS) of
the diamond growth environment in both hot filament and microwave plasma
reactors was pioneered by Hsu and co-workers3.11-3.13, and has
enabled quantitative measurements of the concentrations of H atoms and CH3
radicals, as well as stable species like CH4, C2H2,
etc.
This chapter gives a full description of the design and construction of a similar MBMS system with which we have obtained quantitative measurements of the gas phase composition in a hot filament CVD reactor under different process conditions. A detailed account of the data collection and reduction procedures which enables the determination of the mole fractions of both the stable neutral and the free radical species prevalent in the hot-filament CVD process, are also included.
3.4 Molecular beam mass
spectrometer design
In designing a sensitive gas-phase analysis technique to optimize quantitative data collection from a reaction chamber such as the hot filament CVD reactor, careful considerations have to be made first about the problems specific to sampling from such a chamber during the CVD process (Table 3.5).
(1) Very hot substrate/gas
temperatures (900°C & 2000°C respectively),
(2) Aggressive gases (H atoms,
HCl, NH3, etc.),
(3) Relatively high process
pressures (20 Torr),
(4) By-products (e.g. soot),
(5) Low concentrations of
reactant carbon species,
(6) Regular venting of the CVD
chamber,
(7) Possibility of performing
spatial distribution studies,
(8) Detection of free radicals.
Table 3.5.
Problems specific to sampling from a hot filament CVD reactor.
The design of the two-stage MBMS has been optimized to sample from a filament assisted CVD process chamber operating at ~20 Torr. Figure 3.5 shows a schematic diagram of the molecular beam mass spectrometer which has been coupled to the hot filament CVD reactor.
Figure 3.6
shows the minor modifications that have been made to our standard process
chamber so that the substrate and filament assembly can move in the x,z plane relative to the MBMS sampling
orifice, thus enabling spatial distribution studies.3.14 A schematic diagram of the geometry of the
MBMS sampling system, shown in Figure 3.7, indicates that in this study we
do not sample gas via an orifice in
the substrate, which would include the detection of hydrocarbon species resulting from gas/solid
heterogeneous reactions at the substrate surface, as was performed by Hsu.3.11 The sampling cone arrangement is positioned
so as to sample the process gas mixture at the same radial distance from the
filament as the substrate surface.
Therefore only the gas phase reaction mechanisms are studied.
Gas
from the process chamber is extracted through a 100 mm diameter orifice in a stainless steel
sampling cone. A stainless steel
sampling cone was chosen to withstand the high gas temperatures of around 900°C (a quartz sampling cone had been used but
cracked at these temperatures), as well as aggressive gases such as H atoms, NH3,
and HCl. As Figure 3.8 shows, a water
cooling jacket is incorporated into the apparatus body surrounding the sampling
cone to prevent overheating.
The sampled gas is then collimated by a 1 mm diameter skimmer and has an unobstructed path to the electron ionization chamber of a HAL/3F PIC 100 quadrupole mass spectrometer (Hiden Analytical, Warrington, England). This equipment incorporates many features that are beneficial to this system, and will be discussed later in this section.
Since
the process pressure is typically 20 Torr and the mass spectrometer can only
operate at pressures below 10-6 Torr, differential pumping is
required. Our two stage system utilizes
turbomolecular pumps, the pumping speed being 240 l/s in the first stage and 70 l/s
in the high vacuum MS chamber. The
pressure in each stage during gas sampling is typically 10-3 Torr
and 5´10-7 Torr respectively.
The
signal detected by the mass spectrometer is proportional to the sum of the
background gas and the gas introduced by the molecular beam. In order to obtain the required species
concentrations these two components need to be distinguished and the background
effects eliminated. This can be
achieved by modulating the molecular beam using a piezoelectrically-driven
vibrating reed chopper located between the sampling orifice and the collimating
skimmer, some 5 mm from the MS skimmer.
An opto-reflective switch monitors when the chopper is in resonance and
measures the resonant frequency (ca.
50 Hz). Synchronised TTL signals are
sent to the MS software which control pulse gating to the MS counter. The width
of the signal counting window is variable and is set to 2 ms allowing signal to
be collected only when the path of the molecular beam to the ionisation source
is fully obstructed or unobstructed.
This enables the background signal component to be eliminated from the
total signal, which was of great benefit especially when attempting
quantitative analysis for radical species.
A z-translator consisting of an
edge-welded bellows assembly allows the distance between the skimmer and the
extraction orifice to be varied. A near
linear increase in the detected signal observed as the skimmer-to-extractor
distance is reduced from 12 cm to less than 2 cm (See Figure
3.9). However, if the skimmer is moved
yet closer the pumping speed near the orifice is reduced, becoming conductance
limited, and causes the background pressure to increase so nullifying any
benefit. Figure 3.9 serves to
illustrate the ‘quality’ of our molecular beam by comparing the observed signal
vs. distance measurements with that
expected for the limiting situation - namely a perfect molecular beam and
completely free expansion from a point source.
The system also incorporates an x,y-adjuster
in order to align the MS skimmer with the molecular beam, thereby ensuring
maximum sensitivity.
There is a gate valve between the process chamber and the MBMS system so that the MS can be withdrawn and isolated from the process chamber when the latter is vented to atmosphere for filament/substrate replacements.
(a) Choice of sampling cone
orifice diameters.
Fig.3.10. SEM image of the stainless steel sampling cone
Figure 3.10 shows scanning electron micrographs (SEMs) of the stainless steel sampling cone orifice (~100 mm in diameter) which was made by a spark erosion technique in our mechanical workshop. The diameter of the extraction orifice as well as the collimating skimmer (1 mm) are selected to match the gas influx from the CVD chamber with the gas throughput of the turbomolecular pumps. The sizes of the sampling cone orifice and the skimmer hole determine the pumping speeds required. A large orifice will give large signals, but not only will it be difficult to pump away the sampled gas, but the process environment may be perturbed. A small hole will produce good signal resolution and since less gas is being sampled through the orifice, it will be easier to pump. However, detection of gas phase species will be compromised, particularly when the species we wish to analyze are in low concentrations (£1% in hydrogen). Furthermore, since one of the by-products of the CVD process is soot (at the cooler regions of the chamber), the orifice could easily be blocked, thus further reducing signal intensity. The sensitivity of our sampling system is mainly restricted by what was affordable for purchasing higher speed turbomolecular pumps, so a compromise had to be reached in terms of the orifice diameters employed in our system. We do note that the available pumping speeds are close to the minimum that would be sensible, and that this system is not be very efficient for the detection of free radical species such as methyl radicals.
(b) Two stage differential
pumping
The
important condition to be met when sampling neutral (including free radical)
species is the need for the quadrupole to operate in a background pressure of
10-6 to 10-7 Torr.
Thus one or two stages of differential pumping will be required
depending on the gas pressure in the region to be sampled. Since the process pressure during diamond CVD
is typically 20 Torr, a two stage differential system is incorporated (See
Figure 3.8). Listed below are the
parameters of importance:
a1 = the diameter of the first sampling aperture
between the high pressure gas region
and the intermediate pumping stage (units - cm),
S1 = the net intermediate stage pumping speed
close to the aperture. This will depend on the pumps used (units - litres/second),
a2 = the diameter of the second sampling
aperture which allows the gas sample
(hopefully in the form of a molecular beam) to enter the
quadrupole (units - cm),
S2 = the pumping speed in the quadrupole space
close to the second aperture (units -
litres/second).
The
conductance C of an aperture (in the molecular flow regime) is given for H2
by the relation3.15:
C= 44.24F litres/second
where F = the area of the aperture (cm2),
so
that for a pressure p0 in
the sampled region (20 Torr) the pressure p2
in the quadrupole is given by3.16:
![]() (3.1)
(3.1)
and the pressure in the
intermediate stage by:
![]() (3.2)
(3.2)
In our MS set up:
a1
= 100 mm (i.e. 10-2 cm),
a2 = 1 mm (i.e. 10-1 cm), S1 = 240 l/s and S2 = 70 l/s
Substituting
these values into equations (1) & (2) will give values for p2 and p1 of 10-7 Torr, and 10-4 Torr
respectively. The calculated pressures
are in reasonable agreement with the measured values (5´10-7 Torr and 10-3 Torr
respectively) given to (a) the turbo pumps’ expected inefficiency to pump
lighter gas phase species such as hydrogen, (b) pumping restrictions due to the
conductance of the pumping box and pipework, and (c) the non-absolute nature of
pressures measured by ionisation gauges.
(c) Hiden HAL/3F PIC 100
quadrupole mass spectrometer
Figure
3.11 shows a photograph of the Hiden HAL/3F PIC 100 quadrupole mass
spectrometer set up, which has been coupled to the hot filament CVD
reactor. This equipment incorporates
many features that are beneficial to this system. In the following sub-sections a description of its system
components will be given, together with the data displays available, in
particular the Multiple Ion Detection since this mode was used to obtain all
quantitative measurements of the gas phase composition in the CVD process. Also included is a description of the
relevant probe parameters that were used allowing quantitative data to be
obtained from the MBMS system.3.17
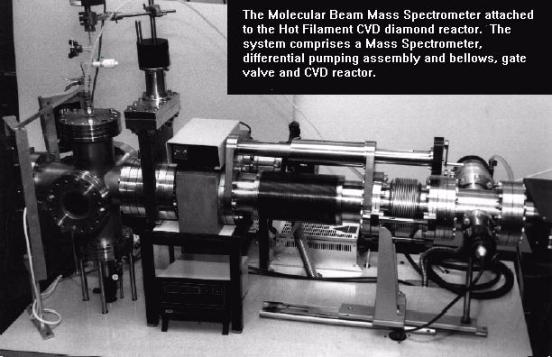
Figure 3.11. Photograph of our Hiden HAL/3F PIC 100 quadrupole mass spectrometer
coupled to the hot filament reactor.
SYSTEM COMPONENTS
Figure
3.12 shows a schematic of the system configuration. The key components and functions are:
(1) Main
Control Unit
This
soft key driven unit is used to control the complete system. The soft key functions are displayed on
screen and are dynamically reassigned with the software menu.
(2) RF
Head
This
mounts on the probe and supplies the RF voltages to the quadrupole.
(3) Probe
This mounts inside the vacuum system, and contains the Source, Quadrupole mass filter and ion counting detector.
Figure 3.12. System block diagram.3.17
DATA DISPLAY
It
is possible to display data in many different forms. The main menu which appears at switch on allows four such display
modes.
(1) BAR Mode is used to obtain a histogram mass spectrum.
(2) PROFile Mode is used to acquire an ‘analogue’ representation of the mass
spectrum showing peak shape.
(3) MID Mode Multiple Ion Detection mode is used for plotting the trend
of various masses against time.
(4) MAP Mode is used to MAP the effect of a lens on the intensity of a
particular ion.
THE MID MENU
Throughout the data collection performed in the present work, the MID mode was used to obtain quantitative measurements of various stable species simultaneously. This mode allows ions within the mass range of the instrument (0 to 100) to be monitored in any order as required, and intensity data may be presented as numerical values (counts per second) or as a scrolling graphical display. The signal intensity of any given species was calculated by obtaining an average numerical value over 8 to 12 readings. A step-by-step method for converting these measured signal intensities into species mole fractions is given in Section 3.6.
The
MID mode incorporates many functions (See Ref. 3.17, pp 30 to 34), but one
worthy of mentioning is the SETUP
menu which allows the per channel MID parameters to be set up. By setting a particular current channel to
monitor mass m ( in the MASS menu),
we are able to detect the desired gas phase species. Key functions apply to the currently selected channel, except for
the CHAN key, which sets the current channel selection. The current channel is the one with the
channel number highlighted. Parameters
are displayed in two pages, one of channels 1 to 8, the other of channels 9 to
16, so up to 16 gas phase species can be monitored simultaneously.
STATUS AND TRIP MENUS
Apart from the various available display modes, there are also two other important set-up modes in the main menu that we use:
(1) STATUS
menu
F1,F2 - These are used to switch
filaments on and off. There are two
filaments in the probe system, F1 and F2 (See Figure 3.13). The F1
key selects and deselects filament 1 operation, and similarly the F2 key selects and deselects filament 2
operation. When a filament is on the
front panel green LED will light and after a few seconds the emission LED will
light if the source and filament are in good condition. An error message will be issued if there is
a filament fault.
DEGAS - Entering the time (n minutes)
followed by the DEGAS key switches
the analyser source into degas mode for n minutes, which can be between 1 and
100 minutes. This removes any gradual
build-up of impurities that may be present on the filament. This facility is used typically once a month
depending on how heavily the mass spectrometer was used.
(2) TRIP
menu
This
mode is used as an over pressure safety trip, in order to prevent damage to the
detector caused by an unexpected surge of gas in the QMS chamber (e.g. air
leaks). A detection limit can be set
for any given mass (e.g. H2, N2 and O2) over
which the trip will be activated and the filament and the HT will be turned
off. In our set up, we have set values
of 1000000, 5000 and 5000 counts per second for mass 2 (H2), mass 28
(N2) and mass 32 (O2) respectively to monitor possible
air leaks into the MS chamber.
PROBE PARAMETERS
Figure 3.13 shows a schematic of the probe. There are a number of parameters which may be grouped in their function under the following headings:
(1) Source Three
parameters
(2) Quadrupole Mass Analyser Two parameters
(3) Ion detector Two
parameters
The parameters may be adjusted in the TUNE menu, either by increment/decrement keys or by direct entry. The former is probably the more convenient method since the parameters used are fairly consistent, requiring very little adjustment. Typical values for the following parameters are listed in Table 3.6.
(1) Source group
EMISS parameter: Allows the electron
emission current collected on the source cage to be set. The value is displayed in microamperes (mA) on the screen when the TUNE menu is
selected.
ENERGY parameter: Sets the energy of
the electrons used to produce ions as they leave the source. The value is displayed in electron volts
(eV) on the screen when the TUNE menu is selected. This allows the alteration of the electron energy during
quantitative analysis thus enabling the detection of reactive species using
threshold ionization information.
CAGE parameter: Sets the voltage on the source cage,
which determines the energy of the ions as they leave the source. The value is
displayed in volts (V) on the screen when the TUNE menu is selected.
(2) Quadrupole mass filter
RES’N parameter: Adjusts the ability of
the mass filter to resolve between adjacent mass peaks at high mass
values. This parameter is displayed on
an arbitrary ± 100% scale on the screen
when the TUNE menu is selected.
DELTAM parameter: Adjusts the ability of the mass
filter to resolve between adjacent mass peaks at low mass values. This parameter is displayed on an arbitrary ± 100% scale on the screen when the TUNE menu
is selected.
(3) Ion detector
SEM parameter: Sets the voltage across the secondary
electron multiplier detector and consequently determines the gain of the
device. The current value is displayed
in volts (V) on the screen when the TUNE menu is selected. Figure 3.14 shows a typical multiplier count
rate/voltage curve. As the SEM voltage
is increased from a low value the count rate increases rapidly between the
threshold voltage Vt, and a plateau voltage Vp. The SEM value should be set very
carefully. If the voltage is set too
high with a high beam current or high gas pressure then permanent damage to the
multiplier may result. It is
recommended that the multiplier voltage should be restricted to the start of
the plateau region (Vp), i.e. operating at about 100 to 200 volts
above the plateau voltage.
DISCRM parameter: Sets a voltage level on a
comparator connected to the pulse amplifier.
If the pulse height is more negative than the discriminator level then
the pulse is counted. Its current value
is displayed on an arbitrary scale of ± 100% on the screen when the
TUNE menu is selected. The
discriminator level should be set below the most negative level of the
background noise to prevent invalid counts, as shown in Figure 3.15.
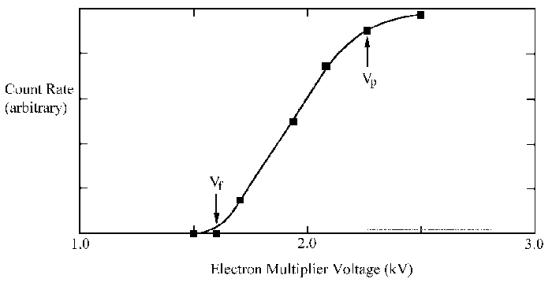
Figure 3.14. Schematic showing the multiplier voltage curve.3.17
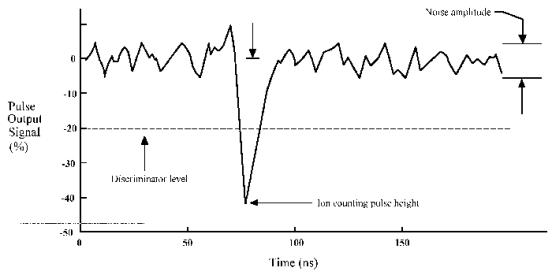
Figure 3.15. An illustration showing where the discrimination level should be set
in order to eliminate any unwanted signal due to background noise.3.17
It
is important to note that the multiplier life time depends on the total charge
collected by the multiplier and the background pressure. This has some
implications as far as multiplier use is concerned:
(1) It is
wise to restrict the multiplier voltage to the start of the plateau
region. This minimises the operating
gain (See Figure 3.16) and the collected charge for each count output.
(2) It is
not advisable to allow the probe to acquire high count rates for long periods
of time unnecessarily. The high voltage
supplies can be disabled (and enabled) using the HT ON/OFF key when data is not actually being acquired.
(3) The
multiplier should be operated with a low background pressure (below 10-6
Torr) if possible. The operating
pressures used throughout the MBMS analysis are kept below 3´10-6 Torr.
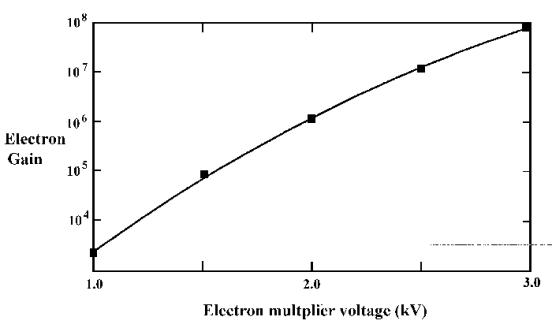
Figure 3.16. A schematic showing a typical multiplier gain curve. It is recommended that the multiplier
voltage should be restricted to the start of the plateau region, Vp
(See Figure 3.14).3.17
TUNING
The precise values for the operating parameters depend specifically on the spectrometer and its application. Typical settings used for each probe type are shown in Table 3.6.
|
DISCRM |
0 to -20% |
|
DELTAM |
0 to -20% |
|
RES’N |
0 to -40% |
|
SEM |
2500 to 2650 V |
|
ENERGY |
vary depending on species
being monitored. |
|
CAGE |
3.0 V |
|
EMISS |
120 to 140 mA |
Table 3.6. Typical operating parameters of our MBMS system.
3.5 Characterization of the
mass spectrometer
(a) Energy scale calibration
Since the actual electron energy in the ionization source of the MS is not necessarily the same as the potential applied to the cathode filament, the energy scale needs to be calibrated. An accurate value for this electron energy is essential as precise threshold ionization energies need to be measured (See Section 3.5 (c) ).
The true MS cathode voltage
can be accurately determined by measuring the ionization potential (IP) of Ar
and correcting to its literature value of 15.76 eV.3.18 Measurements of the cathode voltage against
argon signal were performed for each filament (See Figures 3.17 and 3.18), and
the linear interpolation3.19 method was used to determine the
threshold ionization potentials. In
this method, the linear section of the ionization efficiency curve (a curve
produced when plotting the signal intensity of a given ion versus electron
energy) is extrapolated back to zero signal intensity. The intersection with the energy axis is the
ionization potential of the gas being studied.
This linear interpolation method is not a perfect means of measurement,
due to non-linearity of the graph at lower voltages. This effect is caused by variation in the electron energy
distribution interacting with the ionized species. Although the average energy emitted by the ioniser may be insufficient
to cause ionization of the species, a small spread in the energy distribution
would induce some ionization. We note
that this small spread in the electron kinetic energy distribution (FWHM ~1 eV) may affect the accuracy of the linear
extrapolation method. Inspection of
Figure 3.17 reveals that filament #1 produces an argon ionization
potential of 16 eV compared to the literature value of 15.76 eV. For filament #2 the observed argon IP was 18.4 eV,
with an energy scale correction of 2.64 eV ± 0.3 eV. For continuity filament #1 was used for all of the subsequent
readings, and all cathode electron energies have had the calibration correction
applied and are accurate to within 0.5 eV.
(b) MS calibration
When
measuring the signal for species with a particular mass-to-charge (m/e) ratio it is important to eliminate
or at least minimize interference from unwanted ions with the same (m/e) or those arising from fragmentation
of other ionic species. This can be
achieved if it is possible to measure the signal of the species of interest at
an electron ionization energy just below the ionization threshold of the
interfering species. For example, we
can detect the signal for C2H4 (m/e = 28, IP = 10.51 eV) using an electron energy of
13.5 eV, so minimizing signal interference from CO (IP = 14.0 eV) and
N2 (IP = 15.55 eV).
However, in cases where interference from fragmentation is unavoidable
(e.g. detection of C2H4 in the presence of C2H6)
corrections to the signals have to be made using observed fragmentation
patterns.
The
relationship between the signal intensity, I,
of a given species, i, measured at a
given electron energy, Ei,
and its mole fraction, Xi,
is given by
Ii (Ei) = Si Xi
(3.3)
where the sensitivity factor, Si, depends on the ionization cross section of i and the MS gas sampling efficiency,
which may vary for different gas species and the local temperature, pressure
and composition of the gas sample. The
concentrations of the stable species are determined by direct room temperature
calibration of mixtures of known composition ensuring that, for each species
monitored, we use the same user-selected electron ionization energy in both
calibration and data collection cycles and that the total process pressure
remains constant. However, we find that
an additional temperature dependent correction also needs to be made (see
Section 3.5(d) and 3.5 (e) ).
(c) Mass discrimination
Mass
discrimination effects in a molecular beam system on MBMS sampling efficiency
are well known.3.11 These
effects arise with a mixture of gases of varying atomic or molecular weights,
for which it is observed that downstream the centre of the molecular beam has a
disproportionately large concentration of higher mass moieties. This effect is a possible consequence of
pressure driven diffusion or Mach focusing.3.11 Large quantitative errors could be
introduced by mass discrimination when measuring gases of varying compositions.
This
simple calibration procedure described above is justified only for small
concentrations of input gas species (<1%) in hydrogen on the grounds that,
for heavy species diluted in a large excess of hydrogen, the transport of the
process gas through the sampling orifice and subsequent formation of a
supersonic molecular beam are dominated by the mass transport properties of the
hydrogen. However, problems arise with
this calibration procedure when the concentration of a particularly heavy
species, such as Cl2, in the gas mixture is significantly greater
than ~1%.
This is illustrated in Figure 3.19 which shows the attenuation of the CH4
signal (at room temperature) when different amounts of chlorine are added to a
1% CH4 in H2 mixture, an example chosen because of its
relevance to the study of chlorine assisted CVD of diamond. In these cases calibration was carried out
using known amounts of the target gas of interest (e.g. CH4, C2H2,
HCl,..) diluted in the appropriate H2/Cl2 mixture.
Figure 3.19. Variation of measured CH4+ signal as a function of gas composition. The signal for 1% CH4 in H2 is attenuated as the chlorine concentration in the gas mixture increases.
Figure 3.20. Variation of measured Ne+ signal as a function of gas composition. Similar signal attenuation is observed for 1% Ne in H2 as the chlorine concentration in the gas mixture increases.
This signal attenuation
could, in principle, be due to CH4 reacting with the added Cl2
at room temperature or be a consequence of mass discrimination effects in the
molecular beam mentioned above.
Evidence to support the latter explanation, i.e. that the light CH4
molecules are preferentially excluded from the centre of the beam by the heavy
Cl2 molecules comes from the equivalent experiments in which we
replace the 1% CH4 by 1% Ne in H2 (See Figure 3.20). The Ne signal is observed to fall off in a
similar way.
(d) Temperature dependence of
MS sampling efficiency
Using
pure H2 at 20 Torr, the variation of IH2 as a
function of the local temperature, T,
of the gas being sampled, as measured using a K-type thermocouple placed
adjacent to the sampling orifice, shows a T
-0.6 dependence (See Figure 3.21). Similar experiments using pure samples of He (m/e = 4), Ne (m/e = 20) and Ar (m/e =
40) reveal that Si shows
the same temperature dependence for all these pure gases. In our results we assume a similar
temperature dependence to the mass spectrometer sampling efficiency for all the
hydrocarbon species of interest, and correct accordingly (by reference to the
attenuation of the measured H2 signal). This assumption is again justified on the grounds that, for small
concentrations of heavy species in hydrogen, the mass transport properties are
dominated by those of the hydrogen.
Figure 3.21. Variation of the detected signal as a function of the local
temperature of the gas being sampled. For pure gases (H2 and Ne
shown) the fit to the experimental data show a near T-0.6
dependence. For 2% Ar in H2 the Ar signal shows a T-1.6
dependence.
(e) Thermal diffusion effects
For
a two component gas mixture the temperature dependence of the detected ion
signals is different from that measured for a pure gas. For example, Figure 3.21 shows that the Ar+
signal measured for a two component, 2% Ar in H2, gas mixture has a
much greater temperature dependence (~T -1.6)
than that for a pure gas. This
indicates an additional thermal effect for a gas mixture whereby a temperature
gradient induces preferential diffusion of the heavier component in the mixture
away from the higher temperature filament/sampling orifice region. This thermal diffusion (also known as the
Soret effect3.20) has a major effect on the total concentration of
any gas phase species measured in the region of the hot filament. In the following chapters (4-7) the absolute
species concentrations measured 4 mm from the filament are presented with
no additional adjustment being made for the depletion of C/Cl/N/P-containing
species due to thermal diffusion, except when comparing results from the
CHEMKIN computer simulations (See Section 8).
(f) Dissociation patterns
As previously mentioned, in order to minimize interference arising from fragmentation of other ionic species, corrections have to be made to the signals using measured fragmentation patterns. Fragment ions arise as a result of parent dissociation taking place in the ionization region of the mass spectrometer. Table 3.7 below shows the fragments observed for various input gas species:
Gas introduced |
Species observed in the mass spectrometer |
|
CH4 |
CH4+,
CH3+, CH2+, CH+ |
|
C2H2 |
C2H2+,
C2H+, CH+ |
|
PH3 |
PH3+,
PH2+, PH+, P+ |
Table 3.7. Species observed following electron bombardment of various input
gases. Full examples of these cracking
patterns will be shown in the Results Section.
These
dissociation patterns are obtained by plotting a graph of the signal intensity
of each species produced as a function of electron energy. The ionisation potential (IP) of the parent
ion and the appearance potentials (AP) of the species observed following
electron bombardment can therefore be determined by linear interpolation
methods described earlier (See section 3.3 (a) ). The values obtained are then compared with literature values.3.21
Appropriate corrections are then made for signal contributions due to the
fragmented species.
(g) Ionization cross sections
and potentials
The signal intensity of a given species, measured at a particular electron energy, is dependent upon the efficiency with which it can be ionized. This efficiency is expressed as a factor, the ionization cross section, which relates to the size and conformation of the species, as it is associated with the area presented to the incoming ionizing electron.
Also
related to the ionization cross section of a species is its ionization
potential (IP). For hydrogen atoms, the
IP(H+) is the threshold energy required to produce H+
ions by direct electron impact,
IP(H+): e-
+ H ® H+ + 2e- (3.4)
This
must be distinguished from the H+ ions produced via dissociative ionization; the appearance potential (AP) of H+,
AP(H+): e-
+ H2 ® H + H+ + 2e- (3.5)
whereby hydrogen molecules are split to produce both
a hydrogen atom and cation. Often the
appearance potential of a given species is greater than its ionization
potential. For hydrogen, the values for
IP(H+) and AP(H+) are 13.6 eV and 18.0 eV
respectively.3.22 The
difference between these values is typically the bond strength of the H2
molecule. In general radical species
have a lower ionization potential (IP) than neutral species, and hence a larger
ionization cross section at any given electron energy.
(h) Detection of radical
species
To date, models of the reaction mechanisms by
which different hydrocarbon precursors are able to produce high quality CVD
diamond have focused on methyl (CH3) radicals3.23,3.24
and/or acetylene (C2H2)3.25,3.26 as the active
carbon species in the growth process.
Detection of low concentrations of free radicals (e.g. CH3 in
a large excess of CH4 or CH3Cl) requires the use of the
threshold ionization technique3.27 which distinguishes ions
generated by direct electron impact of the radicals from those generated by
dissociative ionization of the parent molecule (See section 3.5 (g) ). Application of this technique for the detection
of methyl radicals, for example, requires the electron energy of the MS
ionization source to be maintained well above the ionization threshold of the
CH3 radicals (IP = 9.84 eV), in order to maximize the detection
sensitivity, yet sufficiently below the appearance potential (AP) of CH3+
from the dissociative ionization of CH4 (14.3 eV). Signal interference from the parent molecule
is thereby minimized. In practice, all
CH3+ signal measurements were made using an ioniser
voltage centred at 13.5 eV, which resulted in a limited amount of fragmentation
of the parent species but was readily corrected using measured fragmentation
data.
(i) Procedure for obtaining
quantitative measurements of CH3 radicals
In
order to quantify the radical species we need to distinguish between the beam
and background components of the MS signal since most of the radical species in
the background component do not survive to be detected. We achieve this by modulating the beam as
described in section 3.4. The
dependence of the CH4+ signal with chopper delay (See
Figure 3.22) shows that ~35% of the total signal
comes from species in the molecular beam.
Figure 3.22. Illustrative diagram showing how the measured CH4+
signal varies as a function of the chopper delay. This indicates that only ~35% of the total signal comes from
species in the molecular beam. The
smooth curve through the points is included to guide the eye.
Ideally
we would eliminate the background components in all the measurements, thereby
enabling the signal intensities of each species to be directly related to their
ionization cross sections. However, the
restricted mechanical pumping speed of the MBMS system precludes such a procedure
because of limitations in sensitivity of the system when modulating the
beam. Instead, in order to correct for
the destruction of CH3 in the background we measured the proportion
of the CH4 in the beam and background components (See Figure 3.22)
and ratio the measured CH3 signal assuming that the CH3
radicals are similarly partitioned between beam and background but that none of
the radical species in the background gas survive to the detector; our
‘corrected’ CH3 signal is thus an upper limit.
Having
corrected for loss of CH3 in the background we can now directly
calibrate for CH3 by using measured ionization cross sections, Q,
for methane3.28 and methyl radicals,3.29 at the
respective electron energies used for detection, and the previously measured
relationship between the CH4 signal intensity and its mole fraction, via
![]() (3.6)
(3.6)
In such a calibration
procedure we assume that the mass discrimination factors for CH4 and
CH3 in excess H2 on formation of the beam are equal.
3.7 References
3.1 C.A. Rego, P.W. May, C.R. Henderson, M.N.R.
Ashfold, K.N. Rosser and N.M.
Everitt, Diamond and Relat. Mater., 4,
770 (1995).
3.2 C.R. Henderson, BSc. 3rd Year Project, University of Bristol (1994).
3.3 Tylan General Instruction Manual (1991).
3.4 F.G. Celii and J.E. Butler, Ann. Rev.
Phys. Chem., 42, 643 (1991).
3.5 C-H. Wu, M.A. Tamor, T.J. Potter and E.W.
Kaiser, J. Appl. Phys., 68, 4825 (1990).
3.6 S.J. Harris and A.M. Weiner, J. Appl. Phys., 67, 6520 (1990).
3.7 S.J. Harris, A.M. Weiner and T.A. Perry, Appl.
Phys. Lett., 53, 1605 (1989).
3.8 S.J. Harris, D.N. Belton, A.M. Weiner and S.J.
Schmieg, J. Appl. Phys., 66 5353 (1989).
3.9 R. Beckmann, B. Sobisch and W. Kulisch, in Diamond Materials, The Electrochemical Society proceedings Series,
Pennington, NJ, Vol. 93-17, p.1026
(1993).
3.10 I. Schmidt, C. Benndorf and P. Joeris,
Diamond and Relat. Mater., 4, 725 (1995).
3.11 W.L. Hsu and D.M. Tung, Rev. Sci. Instrum.,
63, 4138 (1992).
3.12 W.L. Hsu, J. Appl. Phys., 72, 3102 (1992).
3.13 W.L. Hsu, M.C. McMaster, M.E. Coltrin and
D.S. Dandy, Jpn. J. Appl. Phys., 33, 2231 (1994).
3.14 C.A. Rego, P.W. May, C.R. Henderson, M.N.R.
Ashfold, K.N. Rosser and N.M.Everitt,
in New Diamond Science and Technology,
MYU, Tokyo, p.485 (1994).
3.15H S. Dushman Scientific Foundations of Vacuum Technique, edited
by J.M
Lafferty (John Wiley &
Sons, New York, 1962).
3.16Plasma Monitoring with
Hiden Analytical Diagnostic Equipment, Hiden Analytical Warrington, England.
3.17Hiden Analytical Operating Manual, Hal II Ion Counting RGA Systems, manual release 1.3, (1994).
3.18 W. Paul and M. Raether, Z. Physic, 140, 262 (1955).
3.19 R.W. Kiser, Introduction to Mass Spectrometry and Its Applications, Prentice- Hall, INC. Canada, 1965.
3.20 R.B. Bird, W.E. Stewart and E.N. Lightfoot,
Transport Phenomena, John Wiley and Sons, New York, 1960, p.567.
3.21 F.H. Field and J.L. Franklin, Electron Impact Phenomena an the properties
of
gaseous ions, Academic Press, New York, 1957
3.22 J. Berkowitz, Photoabsorption, Photoionization and Photoelectron Spectroscopy,
Academic Press, London, 1977.
3.23M. Tsuda, M. Nakajima and S. Okinawa, J. Am. Chem. Soc., 108, 5780 (1986).
3.24 S.J. Harris, Appl. Phys. Lett., 56, 2298 (1990).
3.25 M. Frenklach and K.E. Spear, J. Mater.
Res., 3, 133 (1988).
3.26 S. Skokov, B. Weiner and M. Frenklach, J.
Phys. Chem., 98, 8 (1994).
3.27 G.C. Eltenton, J. Chem. Phys., 15, 455 (1947).
3.28 H. Chatham, D. Hils, R. Robertson and A.
Gallagher, J. Chem. Phys., 81, 1770 (1984).
3.29 D.P. Wang, L.C. Lee and S.K. Srivastava, J.
Chem. Phys., 152, 513 (1988).