Chapter 7 - Results for C/H/P Systems
7.1
Introduction
The
inability to obtain n-type diamond with reasonable conductivity remains a
persistent obstacle towards the development of diamond based-electronic
devices. It has already been
demonstrated that nitrogen-doped CVD diamond and diamond-like carbon (DLC)
films can exhibit very useful semiconducting properties, which are particularly
important for microelectronics and field emission display applications,6.6-6.8,6.10
though the amount of nitrogen incorporated into the diamond films was found to
be very low.6.1,6.15,6.17,7.1
Phosphorus-doping of CVD diamond7.2-7.8 and diamond-like
carbon films7.9 has also been achieved to yield semi-conductive
n-type material using phosphine (PH3) as a dopant source. Cao et
al.7.10 also studied the growth of phosphorus and nitrogen
co-doped diamond films using a solid compound, ammonium-dihydrogen-phosphate
(NH4H2PO4), as a dopant. As yet, very little is known about the way
in which phosphorus is incorporated into the diamond lattice. According to calculations performed by
Kajihara et al.,7.11
phosphorus has a positive formation energy in diamond (Ef = 10.4 eV) which suggests that P incorporation is
unlikely to occur under normal CVD process conditions. Nonetheless P incorporation was observed in
all cases.7.2-7.8
Furthermore, Spicka et al.7.6
found that the experimental doping efficiency of P, defined as the atomic ratio
of P/C in the films to the atomic ratio of P/C in the gas phase, on films grown
using CH4/PH3/H2 gas mixtures was in the range
of 1 to 1 ´ 10-3,
which was greater than the doping efficiency of nitrogen (1 ´ 10-4).6.1
To date, attempts to
investigate the influence of phosphorus addition on diamond CVD have only been
made by Bohr et al.,7.4
who discovered that introduction of small amounts of PH3 to the
standard 1% CH4/H2 gas mixture during the CVD process
caused significant changes in the morphology, the quality and the growth rate
of the resulting diamond films. The
precise reaction mechanisms attributable to these observations however have not
been studied in detail: this is the subject of the present work. Bohr et
al.7.4 suggested that P additions influenced the growth kinetics
as a result of surface reactions, rather than changes occurring in the gas
activation. Furthermore, they suggested
on the basis of thermodynamic calculations that methinophosphide (HCP) was
probably responsible for the deleterious P influences.
In
this chapter we report on the behaviour of phosphine in hot filament assisted
CVD of diamond in terms of the changes in the gas-phase chemistry when
phosphine is present, using gas mixtures of 1% CH4 with increasing
amounts of PH3 (1000-5000 ppm).
7.2
Experimental Details
(a) Deposition experiments
Table 7.1 below shows the growth
conditions typical for the C/H/P system,
Pressure 20 Torr
Gases 1% CH4 in PH3/H2,
the amount of phosphine varying from 0.1%-0.5%.
Total gas flow rate 100 sccm
Substrate type Si (100) substrates
(manually abraded)
Substrate temperature ~ 900°C
Filament temperature 2300-2400°C (filament current 6½-6¾ A)
Filament/substrate distance 4 mm
Deposition time 6 hours
Table 7.1. Deposition conditions used
for C/H/P system.
(b) Film analysis
The as-grown diamond films were investigated by scanning electron microscopy (SEM), Auger electron spectroscopy (AES) and laser Raman spectroscopy (LRS). The LRS analysis was carried out using a Renishaw Raman System 2000 operating at two excitation wavelengths, (1) 514.5 nm (green) and (2) 325 nm (ultra violet).
(c) Gas phase composition measurements
Gas-phase product distributions were monitored as a function of the filament temperature using the differentially pumped molecular beam mass spectrometer (MBMS). Filament temperatures were measured using a two-color optical pyrometer (Land Infrared) and the filament-to-sampling orifice distance was held at 4 mm for all readings. The absolute concentrations of the species monitored are determined by direct room temperature calibration with mixtures of known composition.
(d) Cracking pattern of PH3
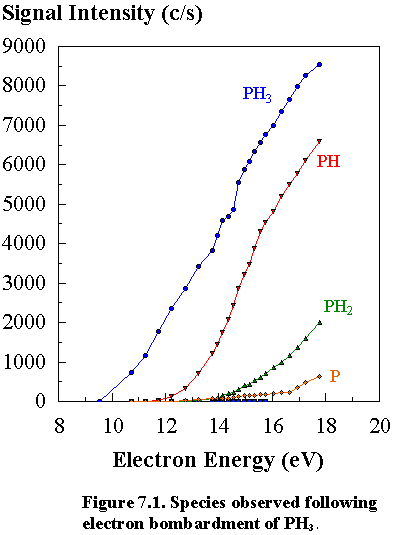
Figure
7.1 shows how the signal intensities of phosphine and its dissociation products
vary as a function of electron energy in the ionization chamber of the mass
spectrometer. By the same linear
interpolation method described in Section 3.5 (a), the measured ionization
potential (I.P.’s) for PH3 and the appearance potentials (A.P.’s)
for the different species observed (PH2, PH and P) were obtained and
compared with literature values (Table 7.2).3.21
|
Species |
Measured I.P. (eV) |
Literature Value (eV)3.21 |
Measured A.P. (eV) |
Literature Value (eV)3.21 |
|
PH3 (m/e=34) |
10.0 ± 0.2 |
10.10 ± 0.2 |
- |
- |
|
PH2 (m/e=33) |
- |
- |
13.8 ± 0.3 (13.5) |
13.9 ± 0.3 |
|
PH (m/e=32) |
- |
- |
12.4 ± 0.4 (12.5) |
12.0 ± 0.3 |
|
P (m/e=31) |
- |
- |
16.3 ± 0.6 (16.0) |
16.7 ± 1.0 |
Table 7.2. I.P.’s and A.P.’s of phosphine and its
observed dissociation fragments.
Figures in parentheses indicate the electron ionisation energies used.
The
A.P.’s of the species observed after electron bombardment of phosphine relate
to the energy required for the following processes:3.21
A.P. (PH2): PH3 ® PH2+
+ H + e-
A.P. (PH): PH3 ® PH+ + H2
+ e-
A.P. (P): PH3 ® P+ + H2
+ H + e-
Inspection
of Figure 7.1 shows that dissociation of PH3 produces mainly PH+
ions, whereas only small amounts of PH2+ and P+
ions are formed. The fact that PH+
ions are formed in preference to PH2+ ions may be due to
the formation of the favourable H2 molecule. The above species were monitored at a user
selected electron ionisation energy shown in Table 7.2 (in parentheses) in
order to minimize the signal contribution arising from the dissociative
ionisation of the PH3 molecule (note that the electron energy used
for PH radical was in fact above its A.P. but this has been corrected for
during data reduction).
7.3 Analysis
of the diamond films

Figure 7.2. Diamond growth rate as a function of PH3
addition to the standard 1% CH4/H2 source gas
mixture at optimum growth conditions.
Scanning
electron micrographs of films grown on Si (100) using 1% CH4/H2
with varying amounts of PH3 as input gas mixtures are shown in
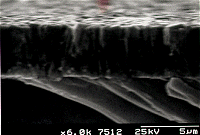
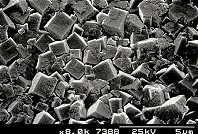
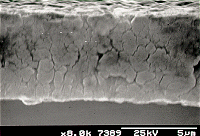
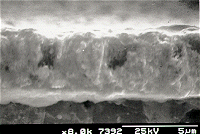
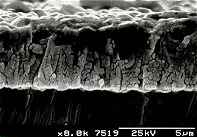
Appendix (II). The diamond growth rates
(Figure 7.2) were calculated from the film thickness, determined from
cross-sectional SEM images, divided by the time of growth (usually 6
hours). The diamond growth rate
increased with the addition of phosphorus, reaching a maximum value of 0.95 mm/h observed at a phosphine
concentration of ~2000 ppm in the gas phase.
The observed trend in the diamond growth rates as a function of [PH3]
in the input source gas mixture is consistent with Bohr et al.7.4 who found similar characteristic maxima
depending on the time of deposition.
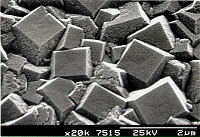
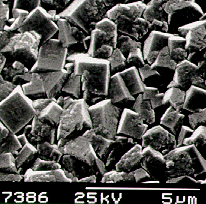
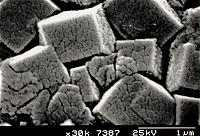
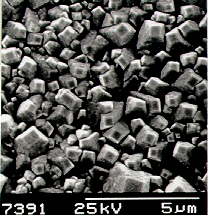
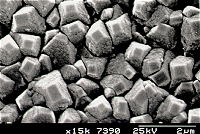
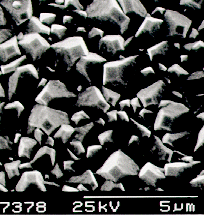
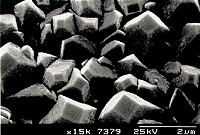
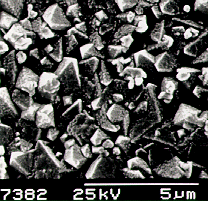
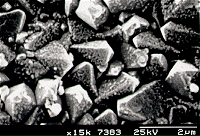
The diamond crystal morphology changed from octahedral (111) facets (at
0 ppm PH3) to predominantly square (100) facets at low [PH3]
(up to 2000 ppm). Higher phosphine
concentrations caused a reversal in crystal morphology back to (111)
facets. AES analysis showed presence of
P in all the films grown with PH3 amongst the source gases.
The green Raman spectra (l = 514.5 nm),
as a function of PH3 addition to the standard 1% CH4/H2
source gas mixture, are shown in Figure 7.3.
The spectra have been displaced vertically from one another for clarity,
but are otherwise unprocessed. The quality
of the diamond films are assessed by the full width half maximum of the
1332 cm-1 Raman line.
The best quality diamond films were produced again at a phosphine
concentration of ~2000 ppm in the gas phase, concomitant with highest observed
growth rates. Figure 7.4 shows the peak
positions and the FWHM (full-width-half-maximum) of the Raman diamond line as a
function of [PH3] in the source gas mixture.

Figure 7.3. Raman spectra of diamond films grown with
different [PH3] partial pressures.
The spectra have been displaced vertically for clarity. The numbers marked on the figure are the
values for the [PH3] addition to the standard 1% CH4/H2
source gas mixture.

Figure 7.4. The peak positions and the FWHM in cm-1
of the Raman diamond line as a function of [PH3] in the source gas
mixture.
LRS analysis was also
performed using an excitation wavelength of 325 nm, and the spectra are
shown in Appendix (III). Different
areas of the film were analysed: (a) the centre of the film, (b) the intermediate
region of the film and (c) the outside edge of the film. Inspection of the Raman spectra reveals that
the graphitic carbon peak (at ~1550 cm-1 wavenumber) increased
with distance away from the centre of the substrate, irrespective of the amount
of PH3 addition to the 1% CH4/H2 gas
mixture. Furthermore, the silicon peak
also becomes more intense towards the edge of the film, indicating that the
film thickness is lower at the edges of the diamond films. These observations are not consistent with
those of Bohr et al.7.4 who
found that the quality of their films improved with distance away from the
centre region. This probably reflects
subtle differences in experimental conditions, e.g. substrate temperature and
its variation with position.
7.4
Gas-phase composition measurements
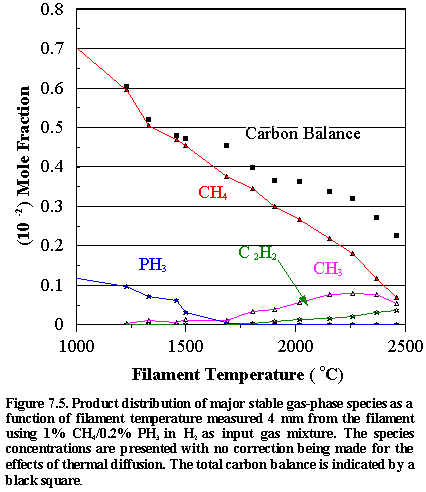
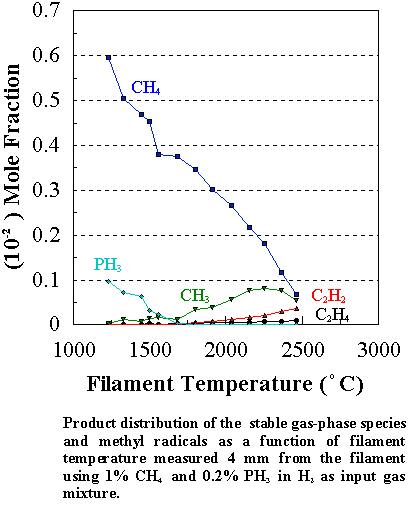
Figure
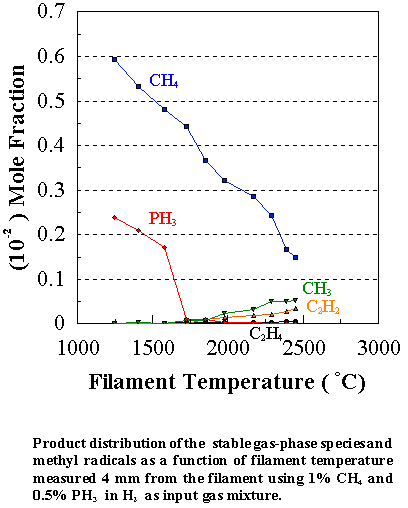
7.5 shows how the distribution of the major observable stable gas-phase species
[CH4 (m/e = 16), C2H2
(m/e = 26), and PH3 (m/e = 34)] and methyl radicals (m/e = 15) vary as a function of filament
temperature for an initial feedstock of 1% CH4 + 0.2% PH3
in H2 measured 4 mm from the filament (See also Appendix IV for
details of the product distributions with different PH3 additions to
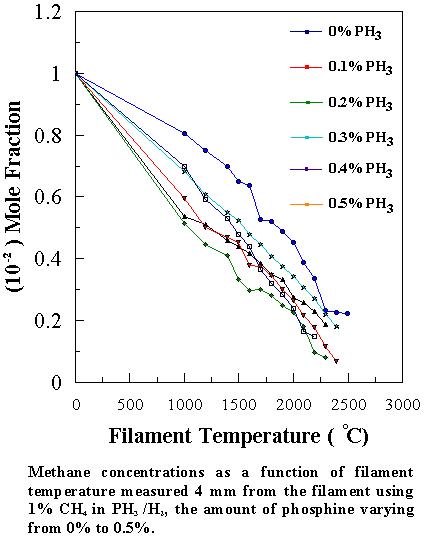
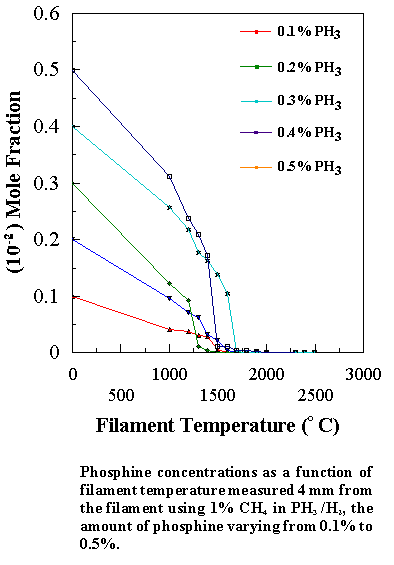
the CH4/H2 source gas mixture). Inspection of Figure 7.5 reveals that the CH4
concentration steadily decreases with increasing filament temperature, whilst
the PH3 concentration drops sharply at ~1500°C. This is due to the relatively weak P-H bonds in phosphine
(321 kJ mol-1).6.22 The absolute mole fractions measured for both precursor gases in
the vicinity of the filament decreases, not only as a result of chemical
reactions but also because of thermal diffusion effects inherent in
multicomponent gas mixtures.5.25
At 1700°C almost all of
the PH3 is decomposed, much of it ending up as a coating of
yellow/red coloured phosphorus on the walls of the CVD chamber. Under optimum growth conditions the highest growth
rates and best ‘quality’ films were obtained using the 1% CH4, 0.2% PH3,
balance H2 gas mixture. This
may be due to the unusually high methyl radical concentrations measured. Since methyl radicals are considered to be
the main growth precursors,3.23,3.24 the presence of higher [CH3]
in the gas phase normally leads to higher deposition rates. Note that the carbon balance, defined as
(total C fraction measured)/(C fraction in the feed gas) and shown as a black square in Figure 7.5,
decreases as the filament temperature increases, because of the thermal
diffusion effects mentioned above.
Similar trends were observed for other PH3/CH4
input ratios, namely that [CH3] was always larger than in the
corresponding CH4/H2 mixture at growth temperatures,
though its absolute concentration decreased with increasing [PH3] in
the feed gas (Figure 7.6). This was
marked by a corresponding decrease in the growth rate and the quality of the diamond
films (Figures 7.2 and 7.4).
The variation of the CH3 mole fraction as a function of [PH3]
in the feed gas at optimum growth conditions is shown below in Figure 7.7.


Figure 7.7. The relative concentrations of methyl
radicals (CH3), methinophosphide (HCP) and the sum as a function of
PH3 addition to the standard 1% CH4/H2 source
gas mixture at optimum growth conditions.
The HCP concentration should be interpreted with caution because the
absolute mole fraction could not be determined using direct room temperature
calibration, and so the values were obtained using the total carbon balance
method described below.
Bohr
et al. suggest that the observed
changes occurring in the CVD diamond growth process with phosphine addition are
due to the creation and subsequent reactions of the HCP molecule.7.4 However, they were unable to detect such a
species because it is stable only below -124°C.7.12 For this reason, the absolute concentrations
of HCP cannot be determined by direct room temperature calibration using
molecular beam mass spectrometry.
However, signal due to the HCP transient species was detected,
presumably because the mean free path of this molecule in the high vacuum side
of the apparatus is long enough to permit a collisionless time of flight
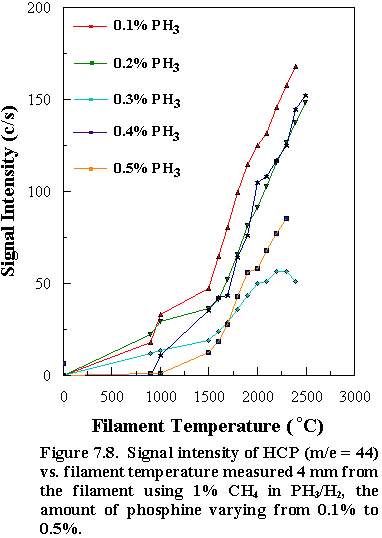
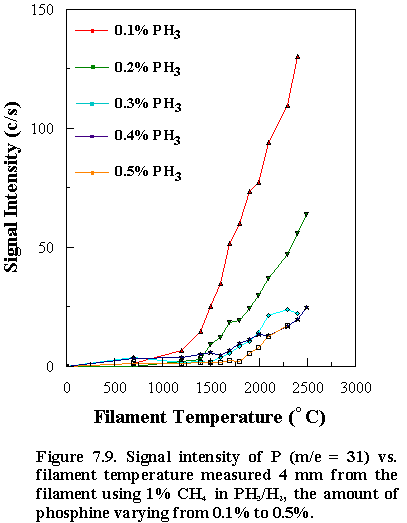
through the MBMS system. Qualitatively,
the HCP signal intensity (m/e = 44)
increased with increasing filament temperature for all ratios of PH3/CH4
studied. In addition, the detected P
signal (m/e = 31) also
showed similar trends as a function of filament temperature
(See Figures 7.8 and 7.9).
However,
it is possible to estimate a value of the HCP mole fraction in the gas phase
during the CVD process, by taking the difference between the total carbon
balances measured using a 1% CH4/H2 mixture in the
absence of PH3, and the balances measured with added PH3. These values are plotted as a function of
[PH3] in the input gas mixture at growth temperatures (2400°C) and are shown in
Figure 7.7. Inspection of
Figure 7.7 suggests that the overall growth rates and quality of the
diamond films are likely to be due to the presence of HCP as well as CH3
radicals in the gas phase. The optimum
deposition conditions seem to occur at an input PH3 concentration of
~2000 ppm, accompanied by the highest [HCP] and [CH3] in the
gas phase (Figure 7.7). Such conclusions accord with the results of
thermodynamic calculations7.4 which predict methane and
methinophosphide (HCP) to have the highest mole fractions in gas phase H2/CH4/PH3
mixtures at growth temperatures.
The
observed species composition can be rationalised by considering the effects PH3
molecules have on the gas-phase chemistry during the CVD process. As Figure 7.5 shows, because of the
weakness of the P-H bond, almost all the PH3 dissociates (ultimately
to produce phosphorus and three hydrogen atoms) at temperatures below ~1600°C:
PH3 ® ® ® P + 3H (7.4)
As a result, the conversion of methane into methyl
radicals, a reaction which is driven by H atoms, will occur more readily and at
lower temperature than in the conventional CH4/H2 gas
mixtures:
CH4 +
H ® CH3 +
H2 (7.5)
This is consistent with the MBMS results
which show an initial increase in the CH3 concentration with PH3
addition. Thus, addition of small
amounts of PH3 (~2000 ppm) results in a near threefold increase
in the diamond deposition rate, at the process temperatures used in this. We recognise that this effect would be less
dramatic at higher temperatures where normal thermal decomposition of H2
will provide the bulk of the H atoms.
However,
there appears to be another, competing reaction, which instead serves to
deplete [CH3] at higher PH3 mole fractions. This we suggest may be:
CH3 +
P ® HCP + H2 (7.6)
the importance of which will depend
critically on the gas-phase concentrations of the two reactants, namely P and
CH3. Inspection of the
available thermodynamic data7.13 indicates that this reaction is
highly exothermic (DH = -312 ± 15 kJ mol-1). Furthermore, our inability to detect any
intermediate gas-phase species such as PH2, PH or CH3PH2
at any filament temperature suggests that HCP formation does not involve
reactions between CH3 and PH2 (or PH) radicals, or
successive hydrogen abstractions from CH3PH2. If the conservation of carbon balance method
outlined above does allow reliable estimation of the HCP mole fraction, then
Figure 7.7 shows this to be the dominant product from the optimum, i.e. 1%
CH4/0.2% PH3 in H2, gas mixture.
In
standard CH4/H2 gas mixtures, the main chemical
conversion is that of methane to acetylene (C2H2), via methyl recombination and subsequent
H atom abstraction reactions.3.1
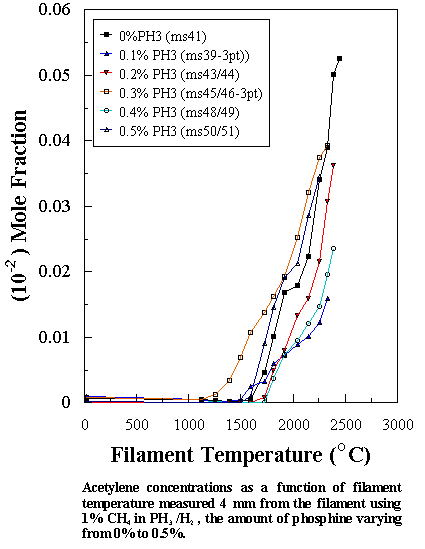
Since the formation of [C2H2] depends on [CH3]2,
the detection of large amounts of gas-phase acetylene in a hot filament CVD
reactor is generally taken as an indicator of high steady state [CH3],
and is correlated with fast diamond film growth. Our MBMS results show that for a CH4/PH3
gas mixture, reactions leading to the formation of both HCºCH (not shown in
Figure 7.7 for clarity) and HCºP are possible,
though acetylene was detected in much smaller quantities than HCP for any given
[PH3] in the feed gas. This
implies that reaction (7.6) is likely to be the dominant CH3 removal
route, leading to high [HCP]. Unlike
the CºN bond in HCN,7.1
which is thermodynamically very stable, the HCºP species can further
decompose to produce CH and P:
HCP ® CH + P (7.7)
and, in the presence of high [H], the CH will
rapidly reform CH3. Thus, at
the growth temperature, there will be a rapid cycling between HCP and CH3,
with high steady-state concentrations of both.
The presence of HCP in the gas phase is thus a result of competition
between reactions (7.6) and (7.7).
Reaction (7.7) however, regenerates P, which effectively acts as a
catalyst for the removal of CH3 to form HCP.
We can therefore understand
the process occurring in the gas phase if we consider reaction (7.6) at two
different [PH3] regimes. At
low [PH3], (< 2000 ppm) and hence low [P], reaction (7.6) will be
suppressed, and the dominant processes will be those resulting from the
additional [H] produced in reaction (7.4).
Therefore, with increasing [PH3] we see increasing [H] from
reaction (7.4), lending to an increase in [CH3] from reaction (7.5),
and a faster diamond growth rate. This
will be particularly true at lower temperatures when the contribution to the
total [CH3] from other sources of H atoms will be reduced.
At
higher [PH3], however, there is now sufficient [P] in the gas phase
for reaction (7.6) to become important.
This reaction begins to use up excess [CH3], and so the
diamond growth rate plateaus and eventually begins to decrease. This behaviour is also reflected in the
observed film quality (Figure 7.4).
The
role of HCP at the growing CVD diamond surface is still unclear, but may
provide an alternative explanation for our observations. Bohr et
al.7.4 suggest that, under their experimental conditions, HCP
has a deleterious influence on the gas-solid heterogeneous reactions occurring
on the substrate surface. However, in
the present work the correlation between the observed diamond growth rates and
the measured [HCP], coupled to the fact that HCP is unstable and likely to
decompose on the substrate surface, suggests that HCP could, under appropriate
conditions, provide a beneficial low energy route to adding C1
species to the diamond surface, resulting in faster growth rates, and the
possibility of diamond growth at lower temperatures. Such a view is supported by the presence of phosphorus in all the
films grown, as determined by AES.
The
influence of phosphine on the diamond growth mechanism remains an area of
research open for much discussion. In situ molecular beam mass spectrometry
has enabled the detection of HCP, though quantitative measurements of this
molecule are impossible to perform using standard room temperature calibration
methods. Future work would include
devising a suitable method to obtain absolute gas-phase concentrations of HCP,
and acquiring a better understanding of its role in the CVD process in terms of
changes in the surface chemistry, and the ability to incorporate P into CVD
diamond films.
7.5
References
7.1 R.S. Tsang, C.A. Rego, P.W. May,
M.N.R. Ashfold, and K.N. Rosser, Diamond Relat. Mater., 6 247 (1997).
7.2 K. Okano, H. Kiyota, T. Iwasaki, Y.
Nakamura, Y. Akiba, T. Kurosu, M. Iida, and T. Nakamura, Appl. Phys. A, 51 344 (1990).
7.3 J.F. Prins, Diamond Relat. Mater., 4 580 (1995).
7.4 S. Bohr, R. Haubner, and B. Lux, Diamond
Relat. Mater., 4 133 (1995).
7.5 M. Kamo, H. Yurimoto, T. Ando, and Y.
Sato in New Diamond Science and Technology,
MRS Int. Conf. Proc., Materials Research Society, Washington, DC, 637
(1990).
7.6 N. Fujimori, T. Imai, H. Nakahata, H.
Shiomi, and Y. Nishibayashi, Mater.Res. Soc. Symp. Proc., 162 23 (1990).
7.7 H. Spicka, M. Griesser, H. Hutter, M.
Grasserbauer, S. Bohr, R. Haubner, and B. Lux, Diamond Relat. Mater., 5 383 (1996).
7.8 J.R. Flemish, S.N. Schauer, R.
Wittstruck, M.I. Landstrass, and M.A. Plano, Diamond Relat. Mater., 3 672 (1994).
7.9 V.S. Veerasamy, G.A.J. Amaratunga, C.A.
Davis, A.E. Timbs, W. Milne, and D.R. McKenzie, J. Phys. Condens. Matter, 5 L169 (1993).
7.10 G.Z. Cao, L.J. Giling, and P.F.A. Alkemade,
Diamond Relat. Mater., 4 775 (1995).
7.11 S.A. Kajihara, A. Antonelli, J. Bernholc,
and R. Car, Phys. Rev. Lett., 66 2010
(1991).
7.12 T.E. Gier, J. Am. Chem. Soc., 108 (1961) 1769.
7.13 M.W. Chase, Jr., C.A. Davies, J.R. Downey,
Jr., D.J. Frurip, R.A. McDonald, and A.N. Syverud, JANAF Thermodynamic Tables,
3rd edn., J. Phys. Chem.
Ref.
Data, 14, Suppl. 1 (1985).
7.6 Appendix
(I) Ionization potentials (taken from Reference 3.21) and the user selected electron energies of the various gas-phase species monitored.
|
Precursor Gas |
Chemical Formula |
Ionization Potential (eV) |
User Selected Electron Energy (eV) |
|
Methyl radical |
CH3 |
9.84 |
13.5 |
|
Methane |
CH4 |
12.98 |
14.8 |
|
Ethylene |
C2H4 |
10.51 |
14.8 |
|
Acetylene |
C2H2 |
11.41 |
16.8 |
|
Phosphine |
PH3 |
10.10 |
14.8 |
|
Phosphorus |
P |
11.00 |
16.0 |
|
Methinophosphide |
HCP |
- |
16.8 |
(II) SEM
Photo Library
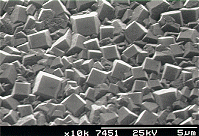 | 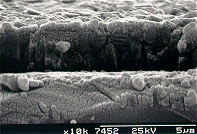 |
Scanning electron
micrograph (SEM) of a film produced on silicon after 6 h growth using
input gas mixtures of 1% CH4 and 0.1% PH3 in hydrogen. | Scanning electron
micrograph showing the cross sectional view of the film. |
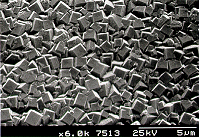 | 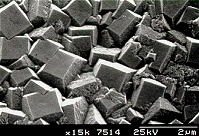 |
Scanning electron
micrograph (SEM) of a film produced on silicon after 6 h growth using
input gas mixtures of 1% CH4 and 0.15% PH3 in hydrogen. | A close up view
of the film surface. |
 |  |
A closer view of
the film surface. | Scanning electron
micrograph showing the cross sectional view of the film. |
 |  |
Scanning electron micrograph (SEM) of a film
produced on silicon after 6 h growth using input gas mixtures of 1% CH4
and 0.2% PH3 in hydrogen. | A close up view
of the film surface. |
 |  |
A closer view of
the film surface. | SEM showing the cross sectional view of the film. |
 |  |
Scanning electron micrograph (SEM) of a film
produced on silicon after 6 h growth using input gas mixtures of 1% CH4
and 0.3% PH3 in hydrogen. | A close up view
of the film surface. |
 |  |
Scanning electron
micrograph showing the cross sectional view of the film. | Scanning electron micrograph (SEM) of a film
produced on silicon after 6 h growth using input gas mixtures of 1% CH4
and 0.4% PH3 in hydrogen. |
 |  |
A close up view
of the film surface. | Scanning electron
micrograph showing the cross sectional view of the film. |
 |  |
Scanning electron micrograph (SEM) of a film
produced on silicon after 6 h growth using input gas mixtures of 1% CH4
and 0.5% PH3 in hydrogen. | A close up view
of the film surface. |
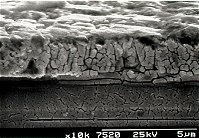 | 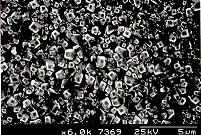 |
Scanning electron
micrograph showing the cross sectional view of the film. | Scanning electron
micrograph (SEM) of a film produced on silicon after 6 h growth using
input gas mixtures of 0.5% CH4 and 0.5% PH3 in hydrogen. |
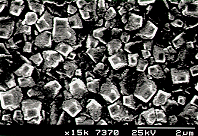 | 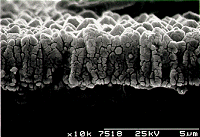 |
A close up view
of the film surface. | Scanning electron
micrograph showing the cross sectional view of the film. |
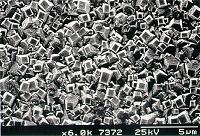 | 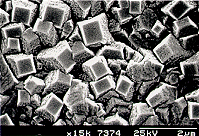 |
Scanning electron micrograph (SEM) of a film
produced on silicon after 6 h growth using input gas mixtures of 0.75% CH4
and 0.25% PH3 in hydrogen. | A close up view
of the film surface. |
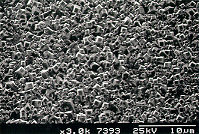 | 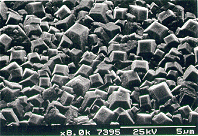 |
SEM showing the
top surface of the same film. | As left |
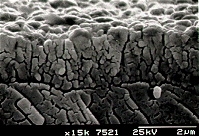 | |
Scanning electron
micrograph showing the cross sectional view of the film. |
(III) Laser Raman spectra
(uv - 325 nm excitation wavelength) of films grown using 1% CH4
in PH3/H2, the amount of phosphine varying from
0.1%-0.5%.
Analyses
were performed on three different areas of each film, namely (a) the centre of
the film, (b) the intermediate region of the film and (c) the outside edge of
the film. Results of diamond film ‘quality’
as a function of [PH3] input show similar trends to those obtained when
using a laser excitation wavelength of 514.5 nm (See Figure 7.4).

Figure I. The peak positions and the FWHM in cm-1
of the Raman diamond line as a function of [PH3] in the source gas
mixture.
(IV)
Experimental Data
1% CH4
in H2 at 20 Torr vs. Filament Temperature
MS Probe Parameters: -20% (DISCRIM), -20% (DELTAM), -40% (RES’N), 2500V (SEM), 3.0V (CAGE), 140mA (EMISS).
MS Pressure =
2.3x10⁻⁶ Torr
Species Mole
Fractions vs. Filament Temperature
|
Fil. Temp (°C) |
CH4 (15.6eV) |
PH3 (14.8eV) |
C2H2 (16.8eV) |
C2H4 (13.6eV) |
CH3 (13.6eV) |
|
25 |
1.000 |
- |
0.000 |
0.000 |
0.000 |
|
1130 |
0.807 |
- |
0.000 |
0.001 |
0.000 |
|
1260 |
0.75 |
- |
0.000 |
0.001 |
0.006 |
|
1390 |
0.699 |
- |
0.000 |
0.001 |
0.003 |
|
1500 |
0.653 |
- |
0.000 |
0.001 |
0.005 |
|
1600 |
0.638 |
- |
0.001 |
0.002 |
0.002 |
|
1730 |
0.529 |
- |
0.005 |
0.005 |
0.003 |
|
1820 |
0.522 |
- |
0.010 |
0.005 |
0.003 |
|
1920 |
0.490 |
- |
0.017 |
0.005 |
0.006 |
|
2050 |
0.453 |
- |
0.018 |
0.007 |
0.009 |
|
2155 |
0.391 |
- |
0.022 |
0.005 |
0.004 |
|
2255 |
0.337 |
- |
0.034 |
0.009 |
0.010 |
|
2330 |
0.235 |
- |
0.039 |
0.007 |
0.008 |
|
2390 |
0.227 |
- |
0.050 |
0.006 |
0.007 |
|
2450 |
0.224 |
- |
0.053 |
0.005 |
0.009 |
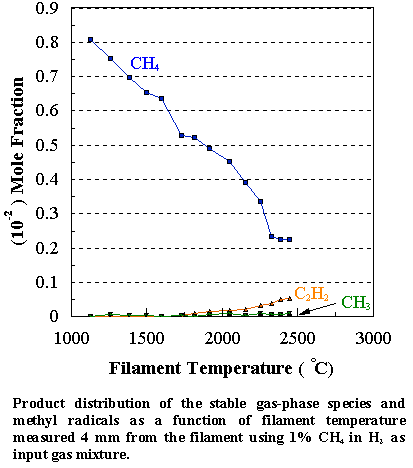
1%
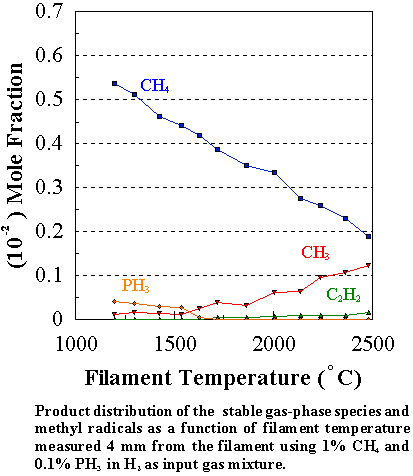
CH4 & 0.1% PH3 in H2 at 20 Torr vs.
Filament Temperature
MS Probe Parameters: -20% (DISCRIM), -20% (DELTAM), -40% (RES’N), 2600V (SEM), 3.0V (CAGE), 140mA (EMISS).
MS Pressure =
7x10⁻⁷ Torr
Species Mole
Fractions vs. Filament Temperature
|
Fil. Temp (°C) |
CH4 (15.6eV) |
PH3 (14.8eV) |
C2H2 (16.8eV) |
C2H4 (13.6eV) |
CH3 (13.6eV) |
|
25 |
1.000 |
0.100 |
0.000 |
0.000 |
0.000 |
|
1200 |
0.539 |
0.042 |
0.000 |
0.000 |
0.011 |
|
1300 |
0.512 |
0.038 |
0.000 |
0.000 |
0.017 |
|
1425 |
0.462 |
0.031 |
0.000 |
0.000 |
0.015 |
|
1540 |
0.441 |
0.029 |
0.000 |
0.000 |
0.013 |
|
1630 |
0.420 |
0.006 |
0.001 |
0.000 |
0.026 |
|
1720 |
0.388 |
0.001 |
0.006 |
0.001 |
0.040 |
|
1868 |
0.352 |
0.001 |
0.005 |
0.003 |
0.033 |
|
2006 |
0.335 |
0.001 |
0.007 |
0.004 |
0.063 |
|
2140 |
0.277 |
0.000 |
0.009 |
0.004 |
0.065 |
|
2240 |
0.259 |
0.000 |
0.011 |
0.006 |
0.096 |
|
2368 |
0.231 |
0.000 |
0.010 |
0.005 |
0.108 |
|
2480 |
0.190 |
0.000 |
0.016 |
0.005 |
0.124 |
1% CH4
& 0.2% PH3 in H2 at 20 Torr vs. Filament Temperature
MS Probe Parameters: -20% (DISCRIM), -20% (DELTAM), -40% (RES’N), 2500V (SEM), 3.0V (CAGE), 140mA (EMISS).
MS Pressure =
7x10⁻⁷ Torr
Species Mole
Fractions vs. Filament Temperature
|
Fil. Temp (°C) |
CH4 (15.6eV) |
PH3 (14.8eV) |
C2H2 (16.8eV) |
C2H4 (13.6eV) |
CH3 (13.6eV) |
|
25 |
1.000 |
0.200 |
0.000 |
0.000 |
0.000 |
|
1230 |
0.597 |
0.096 |
0.000 |
0.002 |
0.003 |
|
1330 |
0.504 |
0.072 |
0.000 |
0.001 |
0.012 |
|
1450 |
0.469 |
0.063 |
0.000 |
0.002 |
0.007 |
|
1500 |
0.454 |
0.033 |
0.000 |
0.002 |
0.014 |
|
1560 |
0.380 |
0.022 |
0.000 |
0.002 |
0.017 |
|
1685 |
0.376 |
0.004 |
0.001 |
0.003 |
0.011 |
|
1802 |
0.346 |
0.001 |
0.005 |
0.004 |
0.035 |
|
1915 |
0.301 |
0.000 |
0.008 |
0.005 |
0.040 |
|
2040 |
0.267 |
0.000 |
0.013 |
0.006 |
0.057 |
|
2157 |
0.218 |
0.000 |
0.016 |
0.006 |
0.076 |
|
2257 |
0.181 |
0.000 |
0.022 |
0.008 |
0.080 |
|
2370 |
0.118 |
0.000 |
0.031 |
0.008 |
0.078 |
|
2465 |
0.068 |
0.000 |
0.036 |
0.010 |
0.055 |
1%
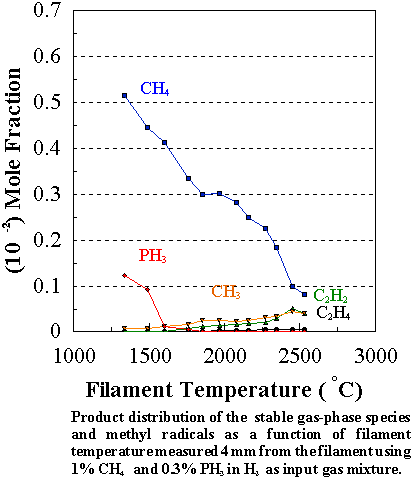
CH4 & 0.3% PH3 in H2 at 20 Torr vs.
Filament Temperature
MS Probe Parameters: -20% (DISCRIM), -20% (DELTAM), -40% (RES’N), 2500V (SEM), 3.0V (CAGE), 140mA (EMISS).
MS Pressure =
7x10⁻⁷ Torr
Species Mole
Fractions vs. Filament Temperature
|
Fil. Temp (°C) |
CH4 (15.6eV) |
PH3 (14.8eV) |
C2H2 (16.8eV) |
C2H4 (13.6eV) |
CH3 (13.6eV) |
|
25 |
1.000 |
0.300 |
0.000 |
0.000 |
0.000 |
|
1342 |
0.515 |
0.123 |
0.000 |
0.002 |
0.007 |
|
1494 |
0.447 |
0.094 |
0.000 |
0.001 |
0.008 |
|
1609 |
0.413 |
0.012 |
0.000 |
0.001 |
0.011 |
|
1767 |
0.334 |
0.005 |
0.008 |
0.001 |
0.015 |
|
1856 |
0.300 |
0.000 |
0.012 |
0.001 |
0.025 |
|
1970 |
0.303 |
0.001 |
0.013 |
0.002 |
0.024 |
|
2086 |
0.281 |
0.000 |
0.017 |
0.004 |
0.022 |
|
2163 |
0.250 |
0.000 |
0.019 |
0.004 |
0.024 |
|
2273 |
0.227 |
0.000 |
0.022 |
0.005 |
0.031 |
|
2350 |
0.183 |
0.000 |
0.029 |
0.005 |
0.035 |
|
2455 |
0.099 |
0.001 |
0.051 |
0.006 |
0.044 |
|
2530 |
0.083 |
0.000 |
0.039 |
0.006 |
0.040 |
1%
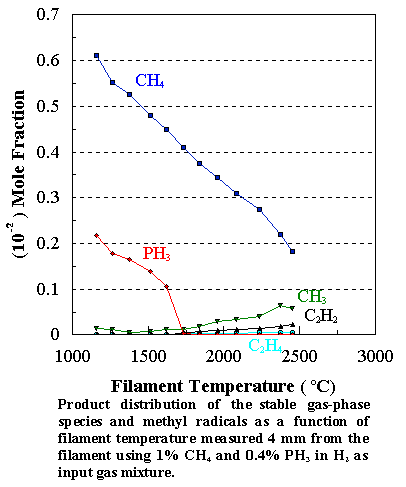
CH4 & 0.4% PH3 in H2 at 20 Torr vs. Filament
Temperature
MS Probe Parameters: -20% (DISCRIM), -20% (DELTAM), -40% (RES’N), 2500V (SEM), 3.0V (CAGE), 140mA (EMISS).
MS Pressure =
6x10⁻⁷ Torr
Species Mole
Fractions vs. Filament Temperature
|
Fil. Temp (°C) |
CH4 (15.6eV) |
PH3 (14.8eV) |
C2H2 (16.8eV) |
C2H4 (13.6eV) |
CH3 (13.6eV) |
|
25 |
1.000 |
0.400 |
0.000 |
0.000 |
0.000 |
|
900 |
0.684 |
0.258 |
0.000 |
0.002 |
0.003 |
|
1160 |
0.611 |
0.218 |
0.0005 |
0.002 |
0.014 |
|
1270 |
0.552 |
0.177 |
0.000 |
0.001 |
0.011 |
|
1380 |
0.526 |
0.164 |
0.000 |
0.002 |
0.006 |
|
1521 |
0.481 |
0.139 |
0.000 |
0.001 |
0.007 |
|
1623 |
0.449 |
0.105 |
0.000 |
0.001 |
0.012 |
|
1735 |
0.409 |
0.003 |
0.004 |
0.003 |
0.013 |
|
1840 |
0.376 |
0.001 |
0.007 |
0.003 |
0.018 |
|
1958 |
0.344 |
0.000 |
0.009 |
0.003 |
0.028 |
|
2085 |
0.309 |
0.000 |
0.012 |
0.004 |
0.035 |
|
2235 |
0.274 |
0.000 |
0.015 |
0.005 |
0.040 |
|
2375 |
0.221 |
0.000 |
0.020 |
0.006 |
0.065 |
|
2455 |
0.183 |
0.000 |
0.024 |
0.006 |
0.058 |
1%
CH4 & 0.5% PH3 in H2 at 20 Torr vs.
Filament Temperature
MS Probe Parameters: -20% (DISCRIM), -20% (DELTAM), -40% (RES’N), 2500V (SEM), 3.0V (CAGE), 140mA (EMISS).
MS Pressure =
6x10⁻⁷ Torr
Species Mole Fractions
vs. Filament Temperature
|
Fil. Temp (°C) |
CH4 (15.6eV) |
PH3 (14.8eV) |
C2H2 (16.8eV) |
C2H4 (13.6eV) |
CH3 (13.6eV) |
|
25 |
1.000 |
0.500 |
0.000 |
0.000 |
0.000 |
|
925 |
0.701 |
0.312 |
0.000 |
0.002 |
0.001 |
|
1250 |
0.593 |
0.239 |
0.000 |
0.000 |
0.002 |
|
1410 |
0.532 |
0.210 |
0.000 |
0.002 |
0.002 |
|
1580 |
0.481 |
0.172 |
0.000 |
0.000 |
0.002 |
|
1725 |
0.443 |
0.011 |
0.001 |
0.002 |
0.008 |
|
1855 |
0.367 |
0.011 |
0.009 |
0.004 |
0.009 |
|
1980 |
0.321 |
0.004 |
0.015 |
0.003 |
0.023 |
|
2170 |
0.285 |
0.004 |
0.019 |
0.003 |
0.033 |
|
2292 |
0.243 |
0.002 |
0.021 |
0.004 |
0.051 |
|
2389 |
0.167 |
0.001 |
0.029 |
0.005 |
0.051 |
|
2455 |
0.149 |
0.001 |
0.035 |
0.006 |
0.053 |
