Chapter 3 - Experimental
“Through the judicious application of microwave energy, the hydrogen plasma discharge can be forged in the shape of a ball.”
F. Jansen et al, J. Appl. Phys. 66 (1989) 5749.
3.1 Introduction
A microwave plasma assisted CVD reactor has been used to deposit diamond films onto silicon (100) wafer substrates. Deposited films were analysed by SEM (see Section 2.3) to determine film morphology, and growth rate. Laser Raman spectroscopy (see Section 2.2) was used to give an indication of the film quality. In some cases secondary ion mass spectrometry (see Section 2.4) was also used as a probe for other elements incorporated in the film. In the first part of this chapter, the experimental system used for diamond growth is described. The deposition procedure, and the problems encountered with the microwave plasma system are also included here. In the second part, the application of MBMS to determine the gas phase composition of diamond depositing plasmas is described. This also includes the experimental procedure, data analysis to provide species mole fractions, and problems encountered.
Diamond growth was attempted using a variety of process gas mixtures. Initially hydrocarbon/H2 mixtures were studied (Chapter 4). The effect of adding gases containing other elements to a typical 1% CH4/H2 mixture was then studied. Principally the effect of adding nitrogen to the C/H system was explored (Chapter 6).
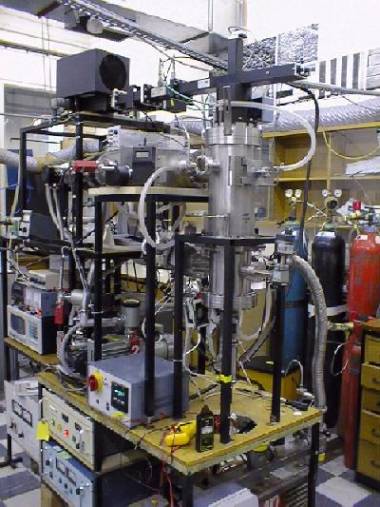
Figure 3.1 Photograph of the experimental apparatus used in this work. The vertical cylinder on the right is the plasma reactor, whilst the molecular beam mass spectrometer is mounted horizontally on the left. The black microwave generator and waveguide are visible at the top of the reactor.
As described in Chapter 1, MBMS possesses many of the capabilities sought after in a gas phase diagnostic technique. Therefore, in this study MBMS has been used to examine plasma composition for the same sets of experimental conditions as those where film growth was attempted. These MBMS studies are presented in the same chapters as the relevant film growth results. MBMS was also used for measurements of the plasma gas temperature (Chapter 5). In the second part of this chapter, the MBMS system is considered sequentially, from sample extraction to detection.
3.2 Experimental System used for Diamond Film
Growth
The components of the microwave plasma reactor used for diamond growth experiments are shown in green in the schematic diagram overleaf (Fig. 3.2 on page 53), whilst the red and blue sections indicate the molecular beam mass spectrometer system components, which will be considered in Section 3.3.
3.2.1 Microwave Circuitry
The fundamental principles underlying microwave plasma reactor operation have already been discussed (Section 1.4). The particular details of the system used in this work will be given here. The microwave generator (ASTeX 1500 W S-1500i) uses a magnetron to produce 2.45 GHz microwave radiation which is transmitted toward the chamber by an air-filled rectangular metallic waveguide. Several components are included on this section of waveguide. Firstly, a circulator was used to allow microwaves to travel toward the reactor chamber, but deflect microwaves which have been reflected back from the reactor into a water cooled ‘dummy’ load, where the excess energy could be dissipated. This protects the magnetron from damage. The next stage of waveguide contains two power meters which measure the levels of forward (i.e. total) microwave power supplied, and that reflected from the plasma
Figure 3.2 Schematic diagram showing Molecular Beam Mass Spectrometer coupled to Microwave Plasma CVD reactor.
reactor due to incorrect matching of the waveguide to the reactor load. The power supplied to the reactor cavity is thus the difference between the forward and reflected powers. The next microwave circuit component is the mode converter, which couples microwave energy into the microwave reactor cavity via a moveable antenna. The rectangular waveguide is terminated by a reflective metal blanking plate. The bottom of the mode converter is a section of cylindrical waveguide which ends in a flange and bolts onto the reactor top. The reactor top is formed by a stainless steel retaining ring which uses two Viton O-rings to clamp in place a ~1 cm thick ´ 12 cm diameter circular quartz window. The window allows microwaves to enter the reactor chamber, whilst the O-ring seals ensure vacuum integrity. The O-rings also limit the maximum power that can be used, as they are liable to burn if they become too hot.
3.2.2 Microwave
Plasma Reactor: Vacuum System Design
The main body of the reactor consists of a double-skinned stainless steel tube of 147 mm inside diameter. The double-skinned walls are water cooled to prevent reactions on/damage to the walls [[1]]. Two 38 mm quartz viewing windows (mounted in Conflat 75 mm o.d. flanges) sit on opposite sides of the reactor at the height of the plasma allowing visual inspection of the chamber during operation. These are perpendicular to the page in Fig. 3.2, and not shown. A loading door for wafers up to 100 mm diameter is provided at the same level as the viewing windows. During operation, the door is held shut by the difference in pressure between the atmosphere, and the CVD process pressure. A Viton O-ring ensures vacuum integrity. Also at the same level as the plasma is a 100 mm inside diameter port leading to a Conflat 150 mm vacuum flange. This is the mounting flange for the entire mass spectrometer assembly described in Section 3.3. The sampling probe pictured in Fig. 3.2 (and Fig. 3.6, Section 3.3) was only in place for mass spectrometric experiments, and omitted for diamond growth experiments. Reactor chamber pressure is monitored using an Edwards PR10-K Pirani vacuum gauge, which works over the mTorr to 1 Torr range necessary to assess vacuum integrity. During deposition, a Tylan General CDL-21 0-100 Torr Baratron is used to monitor chamber pressure.
3.2.3 Substrate
Holder / Heater Design
A 100 mm diameter molybdenum substrate holder is mounted axially in the reactor with a bellows at its base allowing vertical translation of the substrate holder and substrate. Such adjustment of the chamber geometry is necessary in the microwave cavity tuning process to improve the matching of the microwave circuit. The substrate holder incorporates a serpentine graphite resistive heating element and a type K thermocouple for temperature measurement. The heater element has a resistance of ~2 W. The substrate holder and heater were obtained from Quality Air Management Ltd. It is now possible to machine new heater elements in house, which is necessary as they can fail occasionally.
Figure 3.3a Photograph of the substrate holder, when removed from the reactor. The view is looking down on, and slightly to the side of the substrate holder. The base flange of the reactor is visible at the right of the picture.
Fig. 3.3b Photograph of the substrate holder with its outer casing removed, exposing the serpentine graphite heater element.
A micro-electronic temperature controller (Eurotherm 815 controller/programmer), reads the temperature obtained from the thermocouple. When the heater is on, the controller selectively supplies current to the graphite element to maintain the thermocouple at the user defined set point temperature. The temperature of the substrate is not known exactly as the thermocouple is not in contact with the substrate. It is believed that the temperature at the substrate is several hundred Kelvin hotter than the set amount due to the effect of substrate heating by plasma gas. In the remainder of this thesis, the term ‘substrate temperature’ where it refers to the present experimental work, will mean the temperature read by the thermocouple.
Figure 3.4 Side view of the heater, showing the position of the graphite heating element and thermocouple.
Power for the heater is fed into the reactor by two copper rods which pass through ceramic vacuum feedthroughs in the base of the bellows, at the bottom of the reactor. The copper rods are quartz-sheathed, and pass up the stem of the holder. These rods are bolted to two copper bars inside the substrate holder. The end of each bar is bolted to a heater support pillar, which in turn bolt to either side of the graphite heater element, completing the heater circuit. The support pillars consist of a conducting graphite cylinder, surrounded by an insulating boron nitride tube. The BN tube is in turn covered by sections of ~5 mm length quartz tubing. The sections of quartz tube surrounding the support pillars keep in place two Mo plates which serve as radiation shields. The entire heater arrangement is supported within the Mo substrate holder casing by a support table assembly. Ceramic insulator breaks are used to keep the support table (and hence substrate holder casing) electrically isolated from the heater circuit. Ceramic breaks also keep the heater isolated from the reactor walls (which are grounded). This allows independent electrical biasing of the substrate holder, via a third vacuum feedthrough for bias enhanced nucleation studies (Appendix B). A fourth vacuum feedthrough in the reactor base allows a quartz sheathed type K thermocouple to pass into the centre of the heater.
The heater is fed power by a 12 V/30 A a.c. power supply, set to 40% of its maximum output, which is the value that the temperature controller has been calibrated to work with. The heater control box also contains two safety interlocks: One interlock is triggered if the water cooling to the reactor is shut off. The second interlock is activated if there is a change in pressure from the controller set-point. Triggering of a set interlock results in the microwave power, heater power, and gas supply being shut off, to prevent a possible explosion.
3.2.4 Exhaust
and Pressure Control
The bottom section of the reactor vessel, below the level of the substrate heater incorporates the exhaust port and pressure gauges mentioned above. A vent valve is incorporated into the chamber to allow the chamber to be refilled with air when removing samples from the reactor. The reactor chamber is evacuated by an Edwards E2M40 two stage rotary vacuum pump, achieving a base pressure of ~10 mTorr. The exhaust line splits into two separate tubes, which both have manual on/off valves, and then rejoin before entering the vacuum pump. One tube is wide (high conductance), whilst the other is narrow (low conductance). The high conductance tube was opened when the reactor was to be pumped to its base pressure rapidly. The low conductance tube was used as the exhaust pathway during deposition. The low conductance tube also has an electronic valve, which allows the rate of gas flow through this route to be precisely controlled. A pressure controller unit reads the chamber pressure from the Baratron gauge during deposition, and compares it with the pre-set value. The pressure controller opens or closes the electronic valve in the low conductance tube depending on whether the pressure in the chamber has gone too high or low, respectively. This allows the pressure in the chamber to be maintained at its set point to within 0.1 Torr. The reaction gas mixture is introduced to the reactor chamber by a ring-shaped ‘sprinkler’ tube which is incorporated into the topmost flange of the reactor body, just below the quartz window.
Exhaust from the main rotary pump (and also the mass spectrometer pumps) enters an exhaust tube. The exhaust tube exits the building, leading to the safe disposal of H2 and toxic gases produced in the CVD reactor.

Figure 3.5 CVD reactor diagram, with emphasis on the system gas handling.
3.2.5 Gas
Supply and Handling
The composition of the inlet gas mixture is fixed by supplying each individual gas through a calibrated mass flow controller (MFC). The source of each gas depends on its nature, but all gases (except HCN) were obtained as high purity commercial products supplied compressed in gas cylinders. A regulator was used to step down the output pressure of cylinders to ~20 psi. A summary of the gas handling equipment used is given in Table 3.1. The gas leaving the MFC’s is mixed in a gas manifold before entering the gas inlet pipe leading to the CVD chamber. A manual on/off valve, and a solenoid valve are positioned on the input gas line between the manifold and the reactor chamber to isolate the gas supply from the CVD chamber.
When purchased, MFC’s are calibrated for a particular reference gas, and have a maximum obtainable flow rate. Because the MFC responds differently to gases other than the reference, a gas conversion factor (GCF) is required to adjust the flow rate set when using the MFC to control the flow of gases other than the reference gas. These GCF’s are tabulated [[2]], and thus correct flow rates can be calculated when using MFC’s to control the flow of different gases. In addition some gases may only be used in specific MFC’s due to their corrosive effects on the MFC components. Hydrogen was always supplied through a 0-300 sccm (standard cubic centimetres per minute) H2 MFC. All other MFC’s used were 0-10 sccm N2 or 0-10 sccm NH3 MFC’s.
|
Input Gas |
Gas Source |
Regulator Used |
MFC Type |
GCF* |
|
H2 CH4 C2H4 C2H2 |
SGC SGC LB SGC |
B B B B |
a b b b |
1.01 0.72 0.60 0.58 |
|
NH3 (l) CH3NH2 (l) HCN N2 |
LB LB GB SGC |
P N N B |
c c b b |
0.74 0.51 0.76 1.00 |
Table
3.1 Detailed information on gas sources
used, MFC’s used and regulators required, together with characteristic
GCF’s ( * relative to N2 [2]).
See key overleaf for explanation of abbreviations.
Table 3.1 Key:
Gas source
(l) Liquid source - uses the vapour pressure of the volatile liquid.
SGC Standard gas cylinder, 2000 psi input pressure, 20 psi output pressure (BOC).
LB Lecture bottle, maximum output pressure of 20 psi (Argo International Ltd).
GB Glass bulb, used for gases or liquid sources. Pressures are low (< 1 atm ), therefore no regulator was required.
Table 3.1 Key: Regulators
B Brass
N None
P Plastic (Matheson Gas Prod.).
Table 3.1 Key: MFC type
a H2 FC 260 Viton MFC (Tylan General).
b N2 FC 260 Viton MFC (Tylan General).
c NH3 FC 260 Neoprene MFC (Tylan General).
Some gases used in this work had particular hazards associated with them which had to be addressed in the course of their use. Thus it was necessary to observe the safety precautions and handling procedures detailed overleaf in Table 3.2:
|
Special Gas |
Safety
Information and Appropriate Handling Procedures. |
|
NH3 |
Toxic and pungent - make sure
laboratory is well ventilated. An NH3 MFC, and a special plastic
regulator is used. |
|
CH3NH2 |
Blocks up MFC very easily. The MFC must be flushed frequently with N2 or argon before re-use. |
|
HCN |
Highly toxic - make sure laboratory is well ventilated. Inform qualified first-aiders of intention to make/use cyanides. |
Table 3.2 Summary of hazardous gases used, and safety precautions taken in the present work.
3.2.6 Preparation
of Samples for Diamond Deposition
Single crystal (100) silicon wafers were used as substrates for all film depositions. In order to promote nucleation of diamond on the smooth Si wafer surface, the substrate surface was pre-treated by manual abrasion with 1-3 mm synthetic diamond grit. This produced scratches where diamond crystallites grow preferentially under CVD conditions. The diamond grit was removed by washing with isopropanol and rubbing with cotton buds. Substrate samples were typically 20´10 mm in size.
3.2.7 Procedure
for Diamond Deposition
In the following chapters (4 and 6), the results of diamond growth experiments are described. A summary of the experimental procedure used for a typical growth run is given here. For all growth experiments the sample was placed at the centre of the molybdenum substrate holder. The door was closed, and the CVD chamber evacuated and tested for gas leaks. Hydrogen gas was then introduced at about 20 Torr - a suitable value to strike the plasma discharge. Once the discharge was initiated, the process conditions to be used for the growth experiment were set. Firstly levels of applied microwave power and reactor pressure were set, and the cavity tuned to minimise the reflected microwave power. The pressure safety interlock was then armed. This safety feature shuts off the microwave power, heater current, and gas supply solenoid valve in the event of a change in reactor pressure (e.g. due to reactor vacuum integrity being compromised). The substrate heater was then switched on, and the substrate temperature climbed to its set point in a couple of minutes. Once the physical deposition conditions were reached, the carbon containing reactants could be introduced to the H2 flow, and deposition begun. Growth was typically carried out for most of a working day (~6 hours), as the reactor had insufficient safety precautions for unattended, overnight running.
To shut down the reactor, diamond growth was stopped by turning off the carbon source gas supply. The plasma and substrate heating were left on for a further 5 minutes whilst the gaseous hydrocarbon species in the reactor were pumped away to leave a pure H2 gas flow. The plasma and substrate heating were then turned off, and the reactor allowed to cool. Once cool, the H2 gas supply could be turned off, and the reactor evacuated. It was then safe to remove the sample by isolating the pumps and opening the vent valve.
3.2.8 Experimental Problems encountered during
Diamond Growth Experiments
The apparatus used for MWCVD is more complex and expensive than that used for HFCVD. Many more maintenance problems were encountered with this system than was found, for example, with hot filament reactors used in our laboratory. As mentioned in the above section, the reactor was not designed for unattended running. Indeed, during ordinary use it was necessary to keep a close eye on the reactor. It was typical for the reactor pressure safety interlock to be triggered about one time in every ten runs. Events such as mains power spikes and plasma instability (Section 3.2.8.2) are the most likely explanations for these failures. It was usually necessary to abort the experiment, unless growth conditions could be quickly restored.
3.2.8.1 Secondary Plasma Formation
When the reactor was first designed and built at the beginning of the project, it utilised a 140 mm diameter substrate holder. This left only ~5 mm between the edge of the substrate holder and the reactor walls. It was found that when a plasma was struck in the centre of the reactor, several ‘secondary’ plasmas were formed around the edge of the substrate holder [1]. The number and position of these varied from run to run, therefore it was difficult to reproduce deposition conditions. One can see how these secondary discharges might occur by studying the model of Wild [[3]], reproduced in Fig. 1.5. The left hand diagram shows that a strong electric field develops at the side of the substrate holder when microwave power is applied to the reactor cavity. If, as in our specific reactor, the gap between the substrate holder and reactor walls is made too small, the electric field at the side of the substrate holder will be further enhanced, resulting in the formation of plasmas at the side of the substrate holder. A survey of reactor geometries used by other research groups, and published in the literature revealed that the gap at the edge of the substrate holder is usually quite large [[4]-[6]]. A second substrate heater was therefore built, with a diameter of 100 mm, leaving approximately a 24 mm gap between the substrate holder and reactor walls. It was found that this new design eliminated secondary discharges from the reactor [[7]]. However, when the plasma is first struck, it is still usual for it to initially form in the gap between the substrate holder and reactor walls. When the microwave circuit is properly matched, the plasma jumps into position above the centre of the substrate.
3.2.8.2 Plasma Instability
The occasional failure of the CVD reactor mentioned above may be due to the plasma ball becoming unstable during operation, and jumping to a different location in the reactor. This happens, for instance, when the pressure is set too high (>55 Torr), or if a spike in the mains power supply occurs - the plasma flickers, and can jump and position itself elsewhere in the reactor. Of obvious concern is that the plasma might position itself in contact with the quartz window. The plasma is hot (~2000 K), and localised (~ few cm extent). If the plasma contacts the quartz window large thermal stresses will result, leading to catastrophic failure of the quartz window. The plasma causes a change in pressure when it jumps; provided the safety interlock has been armed, the gas supply, microwave power, and heater power will be shut off, reducing the risk of an explosion.
3.3 Experimental System used for MBMS
The molecular beam mass spectrometer used throughout this work was identical with the one the previously used at Bristol to study the gas phase composition during HFCVD [[8]-[13]]. The principal difference between that system and the system described here lies in the probe design. A schematic close up of the probe/plasma region during typical operation of the present system is sketched in Fig. 3.6.
Figure 3.6 Schematic close up of plasma region and sampling probe during MBMS studies.
3.3.1 Sampling Probe Design, and Coupling to Microwave Plasma Reactor
A summary of the operation of the molecular beam mass spectrometer has already been given (Section 1.9.2). In this section, the physical design and proportions of the sampling probe/reactor interface will be discussed. For the previous HFCVD MBMS studies [8-12], a sampling cone of ~105° total angle with a 100 mm diameter sampling orifice at its tip was used. The same orifice diameter was maintained in this work as it is the optimum for sampling in the pressure range of interest (20-40 Torr) [12]. However, in the MWCVD reactor, the flange provided for interfacing the mass spectrometer to the reactor is set further back from the reactor centreline, compared with the layout during earlier Bristol HFCVD MBMS studies [8-12]. This necessitated a change from a blunt cone to a tapering probe to take up the extra space. In order to minimise the disturbance of the plasma the probe dimensions inside the microwave cavity had to be reduced, whilst at the same time still allowing the formation of a gas expansion inside the probe and the subsequent ‘freezing’ of chemical reactions that this produces. The probe was thus chosen to be made from a 10 mm diameter ´ 45 mm long molybdenum rod. The Mo rod was bored to an internal diameter of 8 mm for most (~40 mm) of its length. The outside of the tip (the final 5 mm) was machined to produce a truncated cone of half-angle ~45°. The flat, truncated end of the cone is less than 500 mm in diameter, minimising the surface area close to the sampling orifice, and hence the effects of gas-surface chemistry close to the sampling orifice. The inside of the tip was bored via a mechanical drill tip to form a thin-walled cone. The 100 mm extraction orifice was then drilled into the centre of the cone tip using the frequency-doubled output of a Nd-YAG laser (532 nm), focused by a 20 cm focal length lens. This took 5-10 minutes to complete.
Quartz and stainless steel probes were fabricated initially but these were found to be unsatisfactory in the plasma environment. The quartz probe was etched by the plasma, with the result that the sampling orifice diameter increased with time. The stainless steel probe developed a graphitic coating which blocked the orifice after a few hours of use. The molybdenum probe becomes coated with a hard carbon film during growth (which is probably diamond, although no specific test was carried out to confirm this). This reduces the orifice diameter over time at a rate concomitant with typical growth rates in this system (~0.3 mm per hour). Therefore the probe is removed every few weeks to recut the orifice using the Nd-YAG laser. This ensures that the orifice diameter is kept approximately constant. The molybdenum rod was welded to a 1” diameter stainless steel tube (~5 cm long), which has a mounting flange on the bottom (Fig. 3.6). A second probe was constructed, with identical specifications to the first except the molybdenum tube section was 10 mm shorter. This probe will hereafter be referred to as probe 2. Unless otherwise stated, the first Mo probe made, hereafter referred to as probe 1, was used for all mass spectrometric work in this thesis.
The probe mounting flange is bolted to the first stage of the mass spectrometer using a copper gasket as a vacuum seal. The section of the first stage to which the probe attaches is the same as that used to mount the blunt sampling cone in the previous HFCVD MBMS studies [8-12].
3.3.2 Molecular Beam Mass Spectrometer: First Stage
The region inside the probe forms the first stage of the mass spectrometer. Two differential pumping stages are required to reduce the pressure in the mass spectrometer stage to useable values (~1´10-6 Torr). In addition, the pressure in the first stage must be low enough that collisions within the gas expansion are rapidly eliminated, and that collisions with the background gas in the first stage are minimised [[14]-[16]]. The first stage is pumped by an Edwards 240 l/s turbomolecular pump, backed by an Edwards E2M2 two stage rotary pump. Typically this section will pump to a base pressure of ~10-7 Torr. The pressure inside the first stage is <1 mTorr during operation (below pressure measurement with a Pirani PRM-10 pressure gauge).
3.3.3 Molecular
Beam Mass Spectrometer: Second Stage
A 1 mm skimmer orifice was located ~10 cm behind the sampling orifice during mass spectrometric experiments. The skimmer housing and mass spectrometer can be retracted through a bellows allowing closure of the gate valve which separates the UHV mass spectrometer components from the CVD chamber. This enables regular venting of the CVD chamber, whilst leaving mass spectrometer components under UHV. The whole molecular beam mass spectrometer is mounted on a rail, with flexible exhaust hoses connecting the turbomolecular and rotary pumps. Thus the entire mass spectrometric system is wound forward into place prior to mass spectrometric experiments, and wound back out after the experiment. The skimmer forms the entrance to the second stage of differential pumping where the mass spectrometer is housed. The second stage is evacuated by an Edwards 70 l/s turbomolecular pump, backed by an Edwards E2M1.5 two stage rotary pump. The base pressure in this system is 5´10-8 Torr, and remains below 2´10-6 Torr during operation. Pressure in this stage is measured using an Edwards CP25-K Penning ionisation gauge. The second stage pressure during operation, and that obtained in the first stage (<1 mTorr) are in good agreement with the theoretical values calculated by Tsang [12] using formulae from [[17]] for design of molecular beam sampling apparatus. An x,y alignment bellows is incorporated into the second stage for alignment of the mass spectrometer with the molecular beam formed by the skimmer. The back flange of the second stage incorporates a vacuum feedthrough for the RF power supply and electronics associated with the mass spectrometer. The mass spectrometer itself is a Hiden Analytical HAL/3F PIC 100 quadrupole mass spectrometer (QMS).
3.3.4 Considerations for MBMS Studies
The relationship between the signal intensity, I(Y) of species Y, and the mole fraction of Y in the CVD chamber, X(Y), is given by:
I(Y) = S(Y) ´ X(Y), Eq. 3.1
where S is the sensitivity factor for Y. S can be split into a product of two other sensitivity factors: SMS, and SEXP. Thus,
S(Y) = SMS ´ SEXP. Eq. 3.2
And hence from Eq. (3.1):
I(Y) = SMS ´ SEXP ´X(Y). Eq. 3.3.
SEXP accounts for the effects of gas mixture transport through the expansion on the relative abundance of each species in the molecular beam. SMS incorporates the effects of mass spectrometric detection (Section 3.4.1) and therefore depends on the electron impact ionisation cross section of Y (at ionising electron energy, e), the efficiency with which the ion Y+ transits the quadrupole mass filter, and the subsequent detection efficiency of Y+. These are parameters intrinsic to Y that remain constant throughout its experimental detection. SEXP however varies with the local temperature, pressure and composition of the gas sample, and its behaviour is thus of great importance to the experimentalist.
3.3.4.1
Temperature Dependence of the Sensitivity Factor, SEXP
The throughput of gas through an orifice into vacuum as an expansion can be calculated according to the expression [14]:
 Eq. 3.4.
![]() is the mass of gas
passed by the orifice per second, P0 is the source gas pressure (CVD
chamber), and Tg its temperature.
A* is the area of the orifice at its narrowest point (or throat). g
is the ratio of the gas’s specific heat at constant pressure (Cp) to
its specific heat at constant volume (Cv). W is the average molar mass of the gas mixture, and R is the
molar gas constant.
is the mass of gas
passed by the orifice per second, P0 is the source gas pressure (CVD
chamber), and Tg its temperature.
A* is the area of the orifice at its narrowest point (or throat). g
is the ratio of the gas’s specific heat at constant pressure (Cp) to
its specific heat at constant volume (Cv). W is the average molar mass of the gas mixture, and R is the
molar gas constant.
If r0 is the number density of the gas in the sampling region, the ideal gas law states:
P0 = r0 k Tg, Eq. 3.5
where k is Boltzmann’s constant. Hence substituting for P0:
 Eq. 3.6.
i.e. the mass of gas passing through the orifice per unit time is proportional to Tg1/2. The amount of gas detected by the mass spectrometer depends on the amount of gas passing through the orifice, and also on the local number density of gas in the CVD chamber (number of molecules available to travel through the orifice). As the plasma gas is not under extreme conditions of pressure and temperature, ideal gas law behaviour for the gas in the sampling region can be assumed. The number density of molecules in the reactor given by the ideal gas law (Eq. 3.5) is proportional to Tg-1. Thus the amount of gas travelling into the mass spectrometer, and hence the sensitivity factor SEXP, will be proportional to Tg1/2 ´ Tg-1 = Tg-1/2. Experimentally, Rego et al found that the amount of pure gas (e.g. H2, Ne, Ar) flowing into the mass spectrometer (proportional to the mass spectrometer signal) varied as Tg-0.6 [9] - very close to that expected from the above considerations. However, when using a mixture of a ‘heavy’ inert gaseous species (2% Ar) dilute in a light carrier gas (H2) they found that the Ar signal was proportional to Tg-1.6 [9]. This indicates an additional thermal effect, serving to deplete the sampling region of heavy gas species, which was introduced in Chapter 1 as the phenomenon of mass dependent thermal diffusion.
3.3.4.2 Mass
Discrimination
The above considerations show that even in the absence of chemical reactions in the gas expansion, the measured composition of the sampled gas will deviate significantly from the composition in the sampling region. Such effects are solely gasdynamic. A further gasdynamic effect which may alter the measured beam composition relative to that present in the CVD chamber is mass discrimination. It has been found experimentally that for a gas expansion of a mixture containing heavy gases in a lighter gas, the measured concentration of heavier species on the beam centreline was increased relative to the that in the input mixture [15,16]. This effect only becomes important when using large quantities of heavy gases (such as several percent Cl2 added to 1% CH4/H2 [10,12]), and was found to not be important for most ‘light’ hydrocarbons studied during CVD e.g. C2H2, C2H4 [12], as they are present at small concentrations (<1% typically).
3.4 Hiden
Analytical HAL/3F PIC Quadrupole Mass Spectrometer
The mass spectrometer is a complex instrument, and a breakdown of its components and operation will be given in the following sections. There are two main aspects of this instrument: the physical components which make up the instrument, and the software which is used to operate it. A block diagram of the physical components of the mass spectrometer is shown in Fig. 3.7 (overleaf).
Figure 3.7 System block diagram of the Hiden Analytical HAL/3F PIC 100 quadrupole mass spectrometer.
3.4.1 HAL/3F
PIC 100 QMS: Vacuum Components
The vacuum components of the mass spectrometer reside in the second stage of differential pumping. The mass spectrometer vacuum components can be separated into three main parts: Source, Quadrupole mass filter, and Detector, shown in Fig. 3.8.
Figure 3.8 Detail of the three main sections which comprise the mass spectrometer’s physical vacuum components: Source, Quadrupole mass filter, and Detector.
3.4.1.1 Source
The source region is the first part of the mass spectrometer encountered by the molecular beam. The source contains two thoriated tungsten filaments F1 and F2, which produce electrons by thermionic emission. The energy of these electrons can be controlled and set (in the range 0-150 eV) by the mass spectrometer operator. The electrons are not entirely monoenergetic - there is an approximate 0.5 eV spread (FWHM) in energy of the electrons produced by the filament [12]. The electrons ionise molecules in the molecular beam. The ions produced in the source region pass into the quadrupole mass filter.
3.4.1.2 Quadrupole Mass Filter
The quadrupole mass filter consists of four metal rod electrodes approximately 6 mm in diameter, and ~20 cm in length. These rods are parallel, and arranged in a square (see Fig. 3.9). Opposite pairs of electrodes are electrically common. Voltages are applied to opposite pairs of electrodes. The voltages have a d.c. component and an RF component. Ions move in the time dependant electric field created by the voltages applied to the quadrupole rods. This causes ions to travel through the mass filter with oscillatory trajectories (shown schematically in Fig. 3.9). Such trajectories may be resonant or non-resonant, depending on whether the oscillation amplitude is stable, or increases with time respectively. Only ions of a given mass-to-charge ratio (m/q) will be resonant and pass through the mass filter for given RF and d.c. voltage settings. Ions with other m/q ratios are not resonant, and oscillate away from the centreline until they are lost at an electrode. The mass spectrometer has pre-set values for the voltage components necessary to detect each m/q ion signal, so the user does not need to worry about this aspect of mass spectrometer operation. Thus for given voltage settings, the effect of the quadrupole mass filter is to allow ions of one mass to pass directly through the filter, whilst excluding all other ions.
Figure 3.9 Diagram illustrating resonant and non-resonant passage through the quadrupole mass filter. Only resonant ions survive to reach the detector.
3.4.1.3 Detector
Ions which successfully transit the quadrupole mass filter travel to the detector. In the HAL/3F PIC 100 system this is a continuous dynode secondary electron multiplier. Collision of an ion with the detector results in creation of secondary electrons. A high voltage set on the secondary electron multiplier accelerates the secondary electrons, which collide with the detector, releasing more electrons. A cascade is set up, allowing a gain of ~107, generating a measurable current from each ion impact event.
3.4.2 HAL/3F PIC 100 QMS: Computerised Operating System
The mass spectrometer uses menu-driven software. Upon switching on the mass spectrometer main control unit, one sees a start-up screen bearing the Hiden logo. At the right of the screen is a pictorial representation of a keypad panel of eight buttons comprising the SELECT menu. This corresponds to the actual keypad on the right of the machine. Pressing one of the buttons will change the SELECT menu to a sub-menu. A summary of the various sub-menus is given below in Table 3.3:
|
Sub-menu |
Function of
sub-menu |
|
BAR mode |
Used to obtain a histogram mass spectrum. |
|
MID mode |
Multiple Ion Detection mode is used to monitor the temporal evolution of signals. |
|
PROFile mode |
Used to acquire an ‘analogue’ representation of the mass spectrum showing peak shape (*). |
|
MAP mode |
Used to examine the effect of an electromagnetic ‘lens’ on the intensity of a particular ion (*). |
|
TRIP |
Allows trip parameters to be set for system protection. |
|
STATUS |
Used to access filament on/off selection, and degas source. |
|
CHECK |
Access to mass calibration and system diagnostics (*). |
|
CLOCK |
Internal time and date settings (*). |
Table 3.3 Summary of initial sub-menus accessible from the SELECT menu, available upon switching on the mass spectrometer main control unit.
Table 3.3 Key: (*) Operating modes not used in this study.
As only some of the operating modes were used in this study, only the STATUS, MID, BAR, and TRIP modes will be elaborated on here. These sub-menus additionally contain further sub-menus and commands. Only menus and commands pertinent to this work are described herein, and the reader is advised that the range of commands available is very large. Complete command and menu descriptions can be found in [[18]]. Common to all menus (except SELECT) is a RETURN option which allows the user to return to the higher level menu from the current sub-menu.
3.4.2.1 STATUS menu
After switching on the main control unit, the STATUS menu is usually the first menu to be accessed. This contains the F1, F2, DEGAS, and RESET options. F1 and F2 toggle on/off the ioniser filaments 1 and 2 respectively. DEGAS allows the degassing of the source cage. This should be carried out for a few minutes about once a week during periods of heavy mass spectrometer usage. Some commands, such as DEGAS, need a further specification - in this case the time the degas will be carried out for. The required time (in minutes) is input first using the numerical keypad, then the DEGAS button pressed to start the degas procedure e.g. “n DEGAS” degasses the source cage for n minutes. RESET resets the system for use if any of the trip conditions have been met (Section 3.4.2.2).
3.4.2.2 TRIP menu
The mass spectrometer contains delicate components for use under UHV. To prevent damage to these during operation, it is necessary to keep the pressure in the second stage below 5´10-6 Torr [18]. A maximum count rate of 5´106 c/s (counts per second) is also advised [18]. Although these conditions are easily met during normal use, unforeseen events, such as catastrophic failure of the sampling probe, would lead to a substantial over pressure in the second stage and damage the mass spectrometer. Using the TRIP menu, it is possible to set over pressure protection on the mass spectrometer. If the pressure in the second stage (measured by the Penning gauge) rises above the trip level set (using the Penning gauge controller), the secondary electron multiplier and ioniser filament(s) will be switched off automatically. It is not then possible to re-use the mass spectrometer until the pressure is below the trip level, and a system RESET has been performed in the STATUS menu.
3.4.2.3 BAR menu
The BAR mode allows mass spectrometric data to be obtained and displayed as a histogram mass spectrum. This mode is useful when initially starting a mass spectrometric investigation as it displays all mass peaks simultaneously. The user can discern which masses are present in the molecular beam by varying the CVD process conditions and observing which mass peaks (i.e. m/q) show a signal variation, and thus need to be considered in more detailed experiments.
On entry to the BAR mode, an empty mass spectrum is displayed. It is possible to select the mass range studied using the SPAN command by entering “startmass * stopmass SPAN” using the keypad (startmass and stopmass are the lower and upper masses of the range under study). The HAL/3F PIC 100 will detect ions with m/q in the range 1-100 inclusive. The C/S command allows the maximum displayed count rate (y-axis) to be set. The #DEC command allows the number of decades displayed to be set when the mass spectrum has a logarithmic y-axis (toggled with linear y-axis by the LOG key in the ACQ menu). The ACQ key opens the ACQ (acquisition) menu which allows the user to adjust the parameters which govern mass spectrometric data acquisition.
Specifically, the ACQ menu contains the TUNE menu and the HT ON button. The TUNE menu will be considered in Section 3.4.2.6. The HT ON button provides high voltage to the secondary electron multiplier detector (~2500 V). After the HT ON button has been pressed, the pictorial button changes to HT OFF. Pressing HT OFF switches off the high voltage supply to the secondary electron multiplier detector. The LOG key toggles the y-axis of the plot between linear and logarithmic scales. After the high voltage supply has been switched on, it is possible to RETURN to the BAR menu and start the mass spectrometer recording data.
START begins data acquisition. When START has been pressed, the button changes to read STOP. Pressing STOP will terminate data acquisition after the current mass range has been scanned. When STOP has been pressed, but before the current scan has ended, the button again changes to read ABORT. Pressing ABORT instantly terminates data acquisition.
N.B. It is only possible to take data when an ioniser filament has been selected as ‘on’ (F1 or F2 in the STATUS menu), high voltage has been supplied to the detector (HT ON in ACQ or MID menus), and the START button has been pressed (in BAR or MID menus).
3.4.2.4 MID (Multiple Ion Detection) menu
MID was the operative mode used for taking all mass spectrometric data presented in the following chapters of this thesis. Using MID it is possible to monitor up to 16 species simultaneously. The species monitored would be those identified as present in the CVD chamber using a preliminary study in the BAR mode. MID contains two important, relatively large sub-menus: SETUP and TUNE, which are described in the following two sections. In MID mode the mass spectrometer measures the signal for channel 1 for a short period (the dwell time), before adjusting the quadrupole voltages to measure the signal for the mass chosen as channel 2 for its selected dwell time. The mass spectrometer cycles through channels 1-16, repeating until stopped. Data was recorded and averaged as described in Section 3.7.
3.4.2.5 SETUP menu
The SETUP menu is used to define the data acquisition parameters for the 16 possible species measurable in the MID mode. On entering the SETUP menu, the display screen changes to list the species (channels 1-16), and their currently assigned acquisition parameters. These are the species mass and dwell time (time in ms spent recording that particular species channel). To alter the parameters assigned to a particular channel, one types “n CHAN”, which positions the cursor at channel n. It is then possible to alter that channel’s attributes - mass studied and dwell time, by typing the new value and pressing MASS or DWELL, respectively.
3.4.2.6 TUNE menu
The TUNE menu is the main user interface to alter mass spectrometric data acquisition parameters. The adjustable parameters contained within it are displayed throughout at the top of the screen, and can be altered by pressing the relevant menu button. The menu then changes to a selection of up and down arrows with which the parameter can be incremented/decremented.
The DISCRM button allows adjustment of the pulse counter discrimination threshold. The level of discrimination between background and ‘real’ signal can be altered by using the up/down arrow keys to increase/decrease the DISCRM value at the top of the screen. If the pulse height is more negative than the discriminator level the pulse is counted. The discriminator level should be set below the most negative level of the background noise, as shown in Figure 3.10.

Figure 3.10 Illustration showing the discrimination level setting to eliminate unwanted background noise signal counts.
The DELTAM parameter adjusts the mass filter’s ability to resolve adjacent mass peaks at low masses. RES’N adjusts the filters ability to resolve adjacent mass peaks at high masses. DISCRM, DELTAM, and RES’N are displayed on a ± 100% arbitrary scale.
SEM allows the secondary electron multiplier voltage to be altered in the range 0-3 kV. This voltage alters the gain of the detector, and produces saturation behaviour above ~2 kV (Fig. 3.11). It is recommended that the SEM be set slightly (100-200 V) above the plateau voltage. The voltage set using SEM is the voltage applied to the detector when the HT ON button is enabled.
Figure 3.11 Measured saturation behaviour of the secondary electron multiplier detector.
The EMISS parameter controls the current of ionising electrons collected by the source cage. This can be set in the range 20-1000 mA. CAGE sets the voltage applied to the source cage, and determines the energy of the ions as they leave the source region. The ENERGY parameter is frequently used during the course of a mass spectrometric experiment. ENERGY sets the energy of the ionising electrons produced at the ioniser filament (0 to 150 eV). Table 3.4 shows typical operating settings used for the work in this thesis.
|
Parameter |
Typical Setting in Present Experiments |
|
DISCRM |
0 to -20% |
|
DELTAM |
0 to -20% |
|
RES’N |
0 to -40% |
|
SEM |
2500 to 2600 V |
|
ENERGY |
Depends on identity of species being monitored. |
|
CAGE |
3.0 V |
|
EMISS |
120 mA |
Table 3.4 Typical mass spectrometric operating parameters used in the present work.
3.5 Mass Spectrometer Characterisation
As remarked earlier, the mass spectrometer ioniser filaments produce electrons which ionise gas molecules in the molecular beam. The efficiency with which ionisation occurs depends on the kinetic energy of the ionising electron. In particular, the electron must possess sufficient energy to remove an electron from the target molecule. Thus there is a minimum threshold electron energy to create ionisation - the ionisation potential. Different molecules have different ionisation potentials. In order to detect molecule Y, the ionising electron energy, e, must be greater than the ionisation potential of molecule Y, IP(Y). Thus:
Y +e- ÞY+ +2e- (e ³ IP(Y) eV) Reaction 3.1
3.5.1 Energy Scale Calibration
The actual energy of electrons emitted from the ioniser filament may not necessarily correspond to the ENERGY parameter voltage setting. The energy may be offset slightly, when compared with accurate literature values. An energy scale calibration must be performed to ensure that the ENERGY parameter can be corrected so that electrons reach the molecular beam with the required kinetic energy. Ar is a convenient species to use, and IP(Ar)=15.76 eV [[19]]. To perform an energy scale calibration, a known, constant flow of Ar is introduced to the CVD chamber (e.g. 5% Ar/H2). The mass spectrometer signal for Ar+ (m/q=40) is then measured as a function of electron energy. Typical results for filaments 1 and 2 are shown below in Fig. 3.12.

Figure 3.12 Energy scale calibration of filaments 1 and 2, showing the Ar+ signal.
Above the ionisation potential, the Ar signal rises approximately linearly. Interpolation of this straight line to zero signal has been shown to give a reasonable estimate of the ionisation potential [[20]] - certainly to within the accuracy necessary for the purposes of the present work. Filament 1 gives IP(Ar) = (15.8±0.3) eV, and filament 2 gives IP(Ar) = (18.0±0.3) eV. Thus filament 1 needs no offset to be made when setting the ENERGY parameter. Filament 2 requires the ENERGY parameter to be set 2.2 eV (18.0-15.76 eV) lower. Filament 1 was therefore used in preference to filament 2, as it removed the extra complication introduced by the energy offset correction.
3.5.2 Threshold Ionisation Technique
If the energy of an ionising electron is increased, sufficient energy is available not only to ionise the molecule, but to dissociate it as well. Thus dissociative ionisation becomes a possibility at higher electron energies. The threshold for dissociative ionisation of molecule Z, to produce fragment Y+ is termed the Appearance Potential of Y, AP(Y+ from Z). For example, IP(CH4) = 13.1 eV [19]. However, at electron energies, e, greater than 14.3 eV, the following ‘cracking’ reaction pathway also becomes energetically feasible [19]:
CH4 + e- Þ CH3+ + H + 2e-, Reaction 3.2
when e ³ AP(CH3+ from CH4) = 14.3 eV
CH3 is a species extant in the CVD reactor chamber. It can be detected mass spectrometrically using an ionising electron energy greater than IP(CH3) = 9.84 eV, to form CH3+ in the molecular beam. Therefore at electron energies greater than 14.3 eV, the detected CH3+ (m/q=15) signal may arise from two sources: CH3 present in the reactor chamber, and from dissociative ionisation of CH4 in the mass spectrometer. Thus to detect CH3 from the reactor in isolation, the CH3 (m/q=15) signal must be measured at an energy intermediate between 9.84 eV and 14.3 eV. The signal increases with electron energy above the species IP, therefore the ENERGY parameter is set at 13.6 eV, to minimise signal counts arising from dissociative ionisation of CH4, whilst maximising signal intensity. The setting of the ioniser electron energy in such a manner is termed the threshold ionisation technique [[21]]. Account must be taken of possible cracking products interfering with the signals measured for other species. To do this, appearance potentials were experimentally determined by measuring a cracking pattern for each possible bulk hydrocarbon species present in the reactor during CVD. The cracking patterns were obtained in the same way as an energy scale calibration (Section 3.5.1), using the species of interest, rather than Ar. Fig. 3.13 shows an example cracking pattern for C2H4.
Figure 3.13 Experimentally measured cracking pattern of C2H4. C2H, C2, CH2, and CH produced signals too low to be displayed on this scale. These species are therefore only very minor cracking products.
3.5.3 Mass Spectrometer Pressure Considerations
When the sampling probe is first mounted on the mass spectrometer first stage housing, it is necessary to ensure that the copper gasket has made a good vacuum seal. This can be a problem as the probe is mounted deep inside the reactor, on the opposite side to the narrow loading door. This makes it very difficult to manipulate tools inside the reactor to tighten the nuts. To test for a good vacuum seal, the sampling probe is used to sample gas from the chamber. H2 is introduced to the chamber at steadily increasing pressures, and the pressure in the mass spectrometer second stage monitored. The pressure characteristics are checked to ensure that the pressure in the mass spectrometer second stage remains below ~2´10-6 Torr when the chamber pressure reaches 20 Torr. This indicates a good seal at the probe mounting flange. If the nuts have been insufficiently tightened to produce a complete seal the pressure in the mass spectrometer second stage rises very rapidly with chamber pressure. An example of the mass spectrometer second stage pressure is shown below in Fig. 3.14. It can be seen that a linear function provides a good fit to the data. Eq. 3.4 predicts that the mass flow rate through the sampling orifice (proportional to the pressure in the mass spectrometer second stage) is proportional to the chamber pressure. The linear fit to the data in Fig. 3.14 demonstrates this dependence.
Figure 3.14 Mass spectrometer second stage pressure as a function of H2 pressure in the CVD chamber, for probe 1 (100 mm orifice). A linear fit to the data is also shown.
3.6 Experimental Procedure for using the
Molecular Beam Mass Spectrometer
This section will outline the experimental procedure used to operate the molecular beam mass spectrometer in conjunction with the microwave plasma reactor. A specific example of studying the effect of microwave power on gas composition for a 1% CH4/H2 gas mixture at 20 Torr is given:
1) Prior to starting an experiment, the main Edwards E2M40 rotary pump will have been left evacuating all gas lines back to the gas cylinder taps (usually overnight). This allows residual gas to vacate the gas lines.
2) The mass spec. ioniser filament should have been on for at least 5 days prior to the experiment (see Section 3.10 for explanation).
3) The gate valve can be opened, and the mass spectrometer second stage wound forward into position.
4) The species, and mass spectrometer parameters relevant to the experiment are entered into the mass spectrometer main control unit (MID mode). HT ON, then START are pressed.
5) The H2 background signal from the CVD chamber is measured.
6) H2 is introduced to the reactor at 20 Torr (and room temperature). Background signals for all species of interest (except H2) are measured under these conditions. These are checked for ~1 hour to ensure they remain steady over time.
7) The H2 is evacuated from the chamber.
8) The experimental gas flow is set (e.g. 1% CH4/H2), and the mixture introduced to the CVD chamber at 20 Torr.
9) Measurements of the room temperature signal for 1% CH4 and H2 are made (both at 16.0 eV). This serves as a calibration for CH4. Cracking of CH3 from CH4 is possible, so the CH3 signal (at 13.6 eV) must also be measured, to find out how much CH3 signal due to cracking is related to the signal for 1% CH4. Again these measurements are checked for stability with time.
10) The physical deposition conditions may now be set. The plasma is struck, substrate heating applied etc., until deposition conditions are reached.
11) The first experimental condition e.g. 300 W is set, and mass spectrometric analysis of species signals is carried out as described in Section 3.7. Typical species monitored (in addition to CH4, H2, and CH3 mentioned above) are C2H2 (13.2 eV) and C2H4 (11.9 eV).
12) The microwave power is altered, and subsequent measurements of all species signals are taken. This step is repeated until all the experimental conditions of interest have been studied.
13) The plasma and heating are switched off, and the reactor allowed to cool down to room temperature.
14) The gases are evacuated from the reactor, and 1% of each stable species in H2 is fed into the CVD chamber at 20 Torr. The calibration signals representing 1% of each stable species are measured. Possible cracking product signals are also recorded. The calibrations must be performed on the same day as the mass spectrometric experiment to ensure the results are not affected by sensitivity changes of the mass spectrometer with time.
15) The mass spectrometer can then be retracted and the gate valve closed. All gas supplies are shut off, and lines are left pumping back to the gas cylinder taps.
16) Experimental data is fed into a spreadsheet computer program (AsEasyAs), which undertakes the data corrections prescribed in Section 3.8 to yield species mole fractions.
3.7 Mass Spectrometric Data Collection
In the mass spectrometric experiments undertaken in the following chapters, data was recorded manually. The mass spectrometer signal (c/s) of one species was entered into a hand-held calculator, and averaged over 10-20 mass spectrometer scans. Thus an average signal, and associated standard error could be obtained for each species using the calculator’s statistical functions. The process conditions were then altered in accord with the needs of the experiment and another set of readings taken, and so on. Background, and calibration signals were recorded and averaged in exactly the same fashion.
3.7.1 Notation
Such averaged mass spectrometer signals for species Y will be denoted I(Y) for the remainder of this thesis. For example I(CH4) refers to the average mass spectrometer signal for CH4. The subscript ‘BG’, e.g. IBG(CH4) will be used to indicate a background measurement, in this case of the m/q=16 CH4 signal, made at the process pressure and room temperature using an H2 feed gas, prior to the experiment. One important distinction is made for the background signals of hydrogen, IBG(H2). These must be taken from the CVD chamber without any gas present. Background corrected average signals will be given the subscript ‘BGCORR’ (Section 3.8.1). The subscript ‘RT’ indicates that a measurement was taken at room temperature. Temperature corrected average signals receive the subscript ‘TCORR’ (Section 3.8.2). The subscript ‘CAL Y’ indicates that the measurement was taken during a room temperature calibration of Y, obtained by the procedure described in Section 3.8.4. Data converted to mole fractions (following the procedure of Section 3.8.5) are donated by an ‘X’ for mole fraction, and the species identity enclosed in brackets, e.g. methane mole fraction will be written X(CH4).
3.8 Data Analysis Procedure
We measure mass spectrometer signal intensities, however we want to know species mole fractions in the reactor. Since the molecular beam mass spectrometer used in this work was practically identical to that used previously at Bristol to study HFCVD, it was natural that the data collection and analysis techniques developed for that purpose should be used. A most excellent review of the method used previously at Bristol was given by Tsang [12].
We have sought to improve on some aspects of the previous Bristol MBMS studies. Typically in these investigations, it was chosen to use mass spectrometer operating parameters that gave a negligible background, simplifying the correction procedure for the results. This had the disadvantage of producing low signals, which in turn implied large statistical errors, evident in the (often large) scatter of data points in those works. From the outset, it was decided to use different mass spectrometer parameters to increase the signal strength, and thus produce less scattered data. This also increased the contribution of background noise to the measured mass spectrometer signals, requiring that a background correction was almost always necessary for each m/q signal. A summary of the steps in the data analysis procedure is given in the following sections.
3.8.1 Background Subtraction
No vacuum system can be constructed to maintain a perfect vacuum; even the vacuum of ‘empty’ interstellar space contains a thin smattering of atoms and molecules. The mass spectrometer and CVD chamber considered in this thesis are no exception. Background gas therefore exists in each part of the system, and can be detected by the mass spectrometer. This requires a correction to be made to the experimental data - a subtraction to account for residual gas. In the correction procedure reviewed by Tsang [12], the backgrounds IBG(Y) were measured when using just an H2 feed gas, at the experimental pressure used (20 Torr), and room temperature. The background signal for each species was then subtracted from the experimental mass spectrometer measurements obtained during CVD growth conditions.
Thus,
![]() Eq. 3.7
Eq. 3.7
However, we found that, for our larger background values, this sometimes produced nonsensical results - often the background corrected signals were negative, by an amount greatly in excess of the expected error in such a corrected signal. For example, in Chapter 6, where the effect of nitrogen additions to the CVD reactor was examined, a signal was discovered at m/q=28 (Fig. 3.15), which seemed to be from a radical species. A large signal was only observed for a small range of microwave powers (the experimental variable). At other microwave powers the signal was constant at its background level. This level is marked on Fig. 3.15, as is the background measured in 20 Torr of H2 (the background according to the previous Bristol method). It can be seen that the background measured in 20 Torr H2 is too large, thus when the data is background subtracted, much of the data is left negative, when it should be approximately zero (to within experimental error). The effect is not large for bulk hydrocarbon species such as CH4 and C2H2, but becomes significant when the species of interest manifests itself as a small signal on a large background (trace species).
Figure 3.15 Graph showing m/q=28 mass spectrometer signal from a 1.0% CH4/1.0% NH3/H2 microwave plasma as a function of power applied to sustain the plasma.
In order to investigate this phenomenon further, the system and gas lines were pumped out back to the cylinder taps for several days to completely remove residual gas from the supply lines. The background signals of several species in pure H2 gas were studied, with and without a plasma. It was found that the assumption made for previous MBMS studies at Bristol - that the background measured in H2 was the background signal for species during the run (plasma on), was not supported by the data . In the presence of the plasma, background signals are considerably lower than those measured in H2, in agreement with the m/q=28 data shown in Fig. 3.15. Empirically, it was found that a better measure of the background signals can be given using the modified correction procedure given in Section 3.8.5, where a description of this experiment using pure H2 is also given.
3.8.2 Temperature Correction
Since the CVD gas mixture is almost 100% H2, the flow of the gas mixture through the sampling orifice can be assumed to be dominated by the flow properties of H2. The H2 signals during the experiment are lower than those measured in 20 Torr of H2 at room temperature because the sampled gas is at a higher temperature. Such behaviour is a consequence of the temperature dependence of the gas flow through the orifice (mass spectrometer signal µ Tg-0.5, Section 3.3.4.1). The next step of data correction is therefore to rescale the measured species signals to provide a signal which is ‘temperature corrected’ (ITCORR(Y)).
 Eq. 3.8
The ratio, L, used here to ‘multiply up’ the background corrected data for Y is simply the ratio of the (background corrected) H2 signal at room temperature in 20 Torr H2, to the (background corrected) H2 signal taken under an experimental condition (plasma on).
N. B. One small problem with the formula above lies in the interpretation of IBG(H2) in the denominator of L. As explained in Section 3.8.5, background signals are smaller at elevated temperatures. However, it is not possible to measure the background H2 signal in pure H2 gas, and so are unable to correct for the temperature dependence of this background signal. Fortunately, the H2 background is small compared to the H2 signal during experimentation (typically, IBG(H2) ~5´103 c/s, compared to I(H2) ~5´105 c/s). If the temperature dependence of the background signal reduced IBG(H2) in the denominator of Eq. 3.8 to say, 3´103 c/s, this corresponds to an error in the denominator of (5´103-3´103)/5´105 (0.4%). Thus for all practical work, the error introduced by the temperature dependence of the H2 background can be neglected, as this error is small compared with the statistical errors in the species signals we are measuring.
3.8.3 Correction for Cracking Products
In some instances, signals arising from cracking products contribute to the mass spectrometer signal for a particular species. This effect can be minimised by reducing the ionising electron energy, but often cannot be eliminated completely. It is then necessary to include another correction to the species whose signal is being affected. Consider a species Y, which we are interested in measuring, and a species Z, which can dissociatively ionise to produce Y+ at the electron energy set to detect Y, eY. eY is chosen such that:
IP(Y) < eY < AP(Y+ from Z) Eq. 3.9
When the room temperature calibration of Z is performed, the Y+ signal (arising from dissociative ionisation of Z) is also measured at the electron energy used to detect Y throughout the experiment, eY. A signal corrected for cracking products will be denoted ICORR(Y). Therefore,
 Eq. 3.10
where the subscript ‘CAL Z’ refers to the fact that the bracketed quantities were both measured during the calibration of Z.
3.8.4 Room Temperature Species Calibration
The temperature correction step converts the data to a room temperature equivalent signal. Stable species calibration was carried out at room temperature by introducing a known amount (usually 1% in H2) of each stable gas to the CVD chamber at the process pressure (usually 20 Torr). A signal was recorded for that species which, when background corrected, tells us how many c/s a mole fraction of 1% of that species is ‘worth’ at room temperature. The temperature corrected experimental data for that species can then be ratioed to the 1% calibration to give an absolute mole fraction for that particular species. Room temperature calibrations are carried out for each stable species, on the same day, after the experimental measurements have been made and the reactor has cooled down to room temperature. Thus,
![]() Eq. 3.11
Eq. 3.11
Eq. 3.11 assumes that correction for cracking products was also taken into account. For most species this is unnecessary, and ITCORR would be used in place of ICORR in Eq. 3.11 in this case.
3.8.5 Improved Calibration Procedure
It is possible to see why the previous background subtraction procedure produced incorrect behaviour by considering the physical meaning of the arithmetic used in that method. The method (Eqs. 3.7, 3.8) involved subtracting a signal measured at room temperature from a signal measured at an elevated gas temperature Tg. It is known however, that the mass spectrometer signals are strongly temperature dependant (I(Y) µ Tg-1.6 for a dilute, heavy, species Y in H2 [9,12]). Thus background signals measured in H2 at room temperature are expected to be greater than those of the same gas mixture at elevated temperatures (filament or plasma activation), as Fig. 3.15 demonstrates. The most sensible course of action is to change Eq. 3.8 to a physically meaningful equation. An expression which remedies the deficiency of Eq. 3.8 is given in Eq. 3.12:

Eq. 3.12.
This expression does make physical sense as it corrects the problem intrinsic to the old procedure (Eq. 3.8). In Eq. 3.12, the measured mass spectrometer signal for species Y is scaled up by the factor L to give an equivalent ‘room temperature’ signal for Y. It is now permissible to subtract the background for Y measured in 20 Torr of H2 at room temperature, as both quantities are now effectively ‘room temperature’ measurements.
To compare the predictions of the old and new expressions (Eq. 3.8 and 3.12 respectively), a background ratio, R, can be defined in the following way. R relates the experimentally measured true background during hot filament or plasma activation of 20 Torr H2 to the ‘background’ signal measured at room temperature in 20 Torr H2. The R-value serves to normalise the actual background signals, ITRUE BG(Y), to the room temperature background signals measured in 20 Torr H2.
![]() Eq. 3.13
Eq. 3.13
Clearly by this definition all the ‘old’ HFCVD MBMS results [8-13] assume R(Y) = 1.0, i.e. that the true background for each species is that measured in 20 Torr H2 at room temperature. In Fig. 3.16 we demonstrate what happens to the R-values for background signals from several species when 20 Torr of H2 undergoes plasma activation. All gas lines were evacuated for several days prior to this experiment so that any residual gases were cleared from the supply lines. It was found that R is much lower than 1.0 during plasma activation of H2, indicating that the true background of all species during the experiment were less than those measured in 20 Torr H2 at room temperature.
Figure 3.16 Experimental backgrounds from a plasma activated, pure H2 feed, compared with the background predicted using the old, and new, correction procedures. R ratios the ‘true’ background during plasma activation (1000 W microwave power, 20 Torr) to the background reading taken at room temperature and 20 Torr. The new procedure estimate of R was obtained by ratioing the background corrected H2 signal during plasma activation to that at room temperature (see text for details). Units: a.m.u. = atomic mass unit.
Although the proposed new equation (Eq. 3.12) possesses the qualitative features necessary for temperature correction of the data, it is necessary to check that R-value the new procedure predicts agrees with the experimental data in Fig. 3.16. The R-value predicted by the new method can be deduced in the following way. If Eq. 3.8 and Eq. 3.12 are re-written in similar form:
![]() Eq. 3.14a
Eq. 3.14a
![]() Eq. 3.14b
Eq. 3.14b
The new procedure predicts a reduced background, IBG(Y)/L, compared with the old procedure background, IBG(Y). If the new, reduced background is ratioed to the old background, IBG OLD(Y), (and remembering IBG OLD(Y) = IBG(Y)):
![]() Eq. 3.15.
Eq. 3.15.
But the ratio IBG NEW(Y)/IBG(Y) has the same algebraic format as the quantity R defined earlier (Eq. 3.13). Therefore, this ratio, IBG NEW(Y)/IBG(Y), can be thought of as the R value for the new procedure estimate of the background signal, RNEW(Y). Hence,
![]() Eq. 3.16
Eq. 3.16
Thus the new formula predicts that R(Y) = 1/L. This value has been plotted on Fig. 3.16 with the label ‘New procedure’. It is clear that the new formula gives a better estimate of the true backgrounds than the old formula. The new procedure formula for temperature correction (Eq. 3.12) was used in preference to Eq. 3.8 for mass spectrometric data correction of all species studied in this thesis, as it eliminated the problem found with background corrected data becoming negative.
Under the new procedure, calibration of stable species was carried out exactly as in the old procedure (Section 3.8.4), using typically 1% of each species in H2 at 20 Torr and room temperature. It should be stressed, however, that the new procedure does not invalidate the results of the previous Bristol MBMS studies. As stated earlier, mass spectrometric parameters used in those works were such that the contribution of background signals was often negligible.
3.8.6 Calibration of Radical Species
Detection of low concentrations of free radicals requires use of the threshold ionisation technique (Section 3.5.2). Mass spectrometric data collection is carried out in exactly the same way as for stable species. However, direct calibration of the radical species to produce an absolute mole fraction is not possible. Instead, some assumptions are necessary to make an indirect calibration for radicals. The only radical species for which this was attempted in the present work was CH3, for which the same method as the previous Bristol HFCVD studies of CH3 [12] was used. The reasoning behind this method is summarised below.
As indicated in Fig. 3.2, a ‘chopper’ is positioned just in front of the skimmer orifice. The chopper was not actually used in the present work, but was used in that of the previous Bristol HFCVD studies [12]. In that work, the chopper was used to alternatively block, and then admit gas to the mass spectrometer. When the skimmer was blocked, only background gas from the mass spectrometer chamber was detected. However, when the skimmer was not blocked the mass spectrometer measured the signal from the molecular beam plus the mass spectrometer background gas. Thus the proportions of the mass spectrometer signal arising from the molecular beam, and from background gas can be measured. Rego et al used this method to determine that only ~(35±10) % of the total CH4+ signal comes from species in the molecular beam [9]. The assumption was made that CH3+ was similarly partitioned between beam and background components, but that none of the background CH3 survived in the mass spectrometer. It was then possible to use the known ionisation cross-sections of CH4 and CH3, the room temperature CH4 calibration, and the signal partitioning factor (0.35±0.1) to obtain an indirect CH3 calibration by the following equation [12]:
 Eq. 3.17
Here X(CH4) is the CH4
calibration mole fraction (usually 1% in H2). X(CH3) is the CH3 mole
fraction a calibration signal count, ![]() , is to be determined for.
For simplicity X(CH3) is also chosen to be 1%. ICAL(CH4) is the
signal count for the CH4 calibration. Q represents the ionisation cross sections of CH4 [[22]],
and CH3 [[23]],
at their respective electron energies used for detection: Q(CH3) = 0.26 Å2
at 13.6 eV and Q(CH4) = 0.22 Å2 at
16.0 eV. Solving for
, is to be determined for.
For simplicity X(CH3) is also chosen to be 1%. ICAL(CH4) is the
signal count for the CH4 calibration. Q represents the ionisation cross sections of CH4 [[22]],
and CH3 [[23]],
at their respective electron energies used for detection: Q(CH3) = 0.26 Å2
at 13.6 eV and Q(CH4) = 0.22 Å2 at
16.0 eV. Solving for ![]() gives the CH3
calibration signal count. This is
multiplied by the beam:background partitioning factor (0.35±0.1),
to correct for the contribution of background counts. The corrected CH3 experimental signal data can be
ratioed to this calibration value to give absolute CH3 mole
fractions.
gives the CH3
calibration signal count. This is
multiplied by the beam:background partitioning factor (0.35±0.1),
to correct for the contribution of background counts. The corrected CH3 experimental signal data can be
ratioed to this calibration value to give absolute CH3 mole
fractions.
3.9 Reaction of Plasma and Reactor Operating Parameters to the Presence of the Sampling Probe
The electrically insulating (quartz) and conducting (Mo, stainless steel) probes were fabricated to be of similar geometry. This allowed us to compare the effect of probe material on the plasma. In addition, quartz is transparent to microwaves, whereas metals are not, so it is expected a priori that the quartz probe will be less perturbative of the plasma environment. It was found that the level of reflected power, a measure of the efficiency of energy coupling from the waveguide to the reactor chamber, was independent of the probe material. Indeed this parameter only appeared to depend on the level of microwave power set (Fig. 3.17).
Figure 3.17 Reflected power levels measured as a function of applied microwave power with, and without, probe 1 present.
All probes used were sufficiently long that they penetrated the region usually occupied by the plasma in the absence of the probe, and thus all probes displaced the plasma to an extent. This however did not appear to depend on the material from which the probe was fabricated, instead it depended on the extent to which the probe penetrated the ‘normal’ plasma region. The plasma ball is distorted slightly from its usual shape and location by the probe, and its intensity is also changed slightly in some regions. The effect is most significant at low applied microwave powers. An approximate indication of the effect of applied microwave power can be seen in Fig. 3.18.
Figure 3.18 Approximate location of the plasma at two representative microwave power levels: Low (300 W), and high (1000 W).
3.10 Mass Spectrometer Problems Encountered
In addition to discovering inadequacies in the previous data analysis procedure, a second problem hindered us for several months. This problem proved very hard to track down. It was noted that during the course of a days experiment, all mass spectrometer signals would increase with time. This also applied if no gases were fed into the mass spectrometer, and hence only backgrounds from the mass spectrometer second stage were being recorded. This indicated a problem with the mass spectrometer itself. Sometimes the effect was not very pronounced and this was the time when we were able to undertake mass spectrometric experiments and collect meaningful data. At other times it was impossible to use the system as background readings would increase dramatically over the course of a days experiment. Contact with the mass spectrometer manufacturers proved fruitless in elucidating the cause of the problem. Such extreme signal increases are demonstrated in Fig. 3.19.

Figure 3.19 Graph showing mass spectrometric signal increases over time. Region A corresponds to signals measured in 1% CH4/H2 at 20 Torr. In region B, N2 was added in increasing concentrations (each measurement in B represents a concentration increase) from 0 to 5.8%. Region C corresponds to the experiment being left alone for a short period (lunch!). Region D shows the effect of stepping down the N2 concentration in reverse steps to region B.
Previously, in common with [8-12] using the same mass spectrometer system, the mass spectrometer was switched completely off after a days experimenting was finished. Eventually we resorted to leaving the mass spectrometer ioniser filaments on for several days to see how far the background signals would increase. The results of this study are shown in Fig. 3.20. It is apparent that the signal passes through a maximum, and after several days returns to an (expected) small background signal. This behaviour points to a need to run the mass spectrometer ioniser filaments permanently when engaged in a period of frequent mass spectrometric investigations.
Figure 3.20 Behaviour of mass spectrometer second stage background signals (i.e. mass spectrometer retracted, and gate valve closed) with time from switching on the ioniser filaments.
The exact cause of this problem is not known, however the fact that the signals return to ‘normal’ after several days is consistent with the explanation that a layer of contamination (which forms somewhere in the mass spectrometer source region during periods of disuse) is being removed during the ‘burning in’ process.
3.11 References