 Bristol
University.
 Bristol
University.
This page contains information about the following topics:The IR Spectrum Hooke's Law Predictions Based On Hooke's Law The Major Regions of the Spectrum Sampling Techniques Jump To Bottom Of Page
You may also view some assorted IR spectra of various organic molecules.
Infra-red spectroscopy is one type of absorption spectroscopy which is useful to organic chemists - Infra-red radiation has the right energy content (E = hu) to match with vibrational energy levels in molecules, and so absorption of a quantum of infra-red radiation of correct frequency can excite a particular vibration in a molecule. A non-linear molecule has a 3n-6 possible fundamental modes of vibration (n = no. of atoms) and each can, in principle, give rise to an absorption band in the infra-red spectrum, so the spectra of typical organic molecules are complex and can rarely be interpreted completely. Neverless, infra-red spectra can give much useful information. In the first place, every compound has a different spectrum, which can therefore be used as a fingerprint. Secondly although the vibration frequencies of a molecule are, strictly, a property of the whole molecular structure, in particular groups give rise to characteristic vibrations. All aldehydes and ketones show a strong absorption band at about 1700cm-1; to a first approximation this is due to stretching of the C=O carbonyl group. Interpreting an infra-red spectrum is largely a matter of recognising which group frequencies are present and which are not.
The infra-red region of the electromagnetic spectrum lies between the UV/Vis and microwave regions and spans the wavelength range ~1-50 microns (µm) corresponding to wavenumbers of ~10,000 to 400 (cm-1). The most useful region from the viewpoint of functional analysis is the mid-IR region 2.5-15 microns (4000-666 cm-1). Transition energies corresponding to changes in vibrational energy state for many functional groups are located in the mid-IR region and hence the appearance of an absorption band in this region can be used to determine whether specific functional groups exist within the molecule. Additionally the vibration of the molecule as a whole gives rise to a complex pattern of vibrations at low energy that are characteristic of the molecule as a whole and hence can be used for identification.
Molecules which have a charge separation either across the whole molecule or across a specific bond are said to possess a permanent dipole moment. When a molecule vibrates, this permanent dipole also vibrates and can interact with the oscillating electric field of incident infra-red radiation. Molecules which do not have a permanent dipole moment do not absorb IR. Because IR spectroscopy deals with the vibration (and coupled rotation) of molecules and bonds, we can model a chemical bond by representing it as two masses on the end of a flexible spring that can both stretch and bend (deform). Some bonds are instrinsically stronger than others, e.g. a double bond is stronger than a single bond. A molecule can therefore be thought of as a series of balls of different masses joined by springs of different degrees of elasticity.
We can apply Hooke's Law to such simple diatomic bonds and treat them as simple springs which have a fundamental equilibrium frequency defined by the following relation:
Frequency = (1/2 pi c) Sqrt[(F/m)]
where c is the velocity of light (in cm.s-1), F is the force constant of the ond (in dyne.cm-1) and m is a parameter termed the reduced mass which is in turn given by the relation:
m = (m1*m2)/(m1 + m2)
where m1 and m2 are the masses of the atoms (in grams) attached to the bond of strength F.

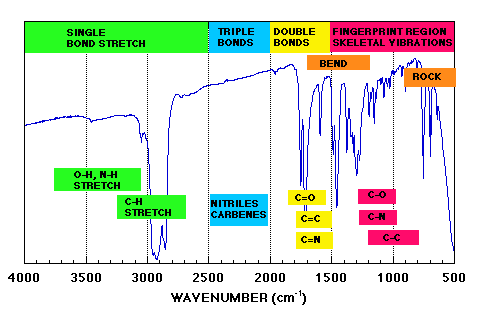
We can identify four general regions.
|
Wavenumber |
Stretch Type |
|
>= 3000 cm-1 |
single bond stretch |
|
2000 - 2500 cm-1 |
triple bond stretch |
|
1500 - 2000 cm-1 |
double bond stretch |
|
"fingerprint" region |
various coupled stretch and deformation bands |
Major functional groups give rise to bands above ~ 1500 cm-1. However the precise pattern of bands seen in the fingerprint region is specific to each compound and provides a molecular "signature" of the molecule which cannot be faked. In this sense IR is an outstanding technique for molecular identification. If there is a precise match between the spectrum of an unknown and an authentic standard then this is a definitive identification. Drug identification is in fact one of the major pharmaceutical applications of IR. Open the USP at any letter of the alphabet and you will find that where a structure is displayed more often than not the official method of identification will be (or include) IR spectroscopy.
Pure liquids can be examined by sandwiching a thin film between two rock salt (NaCl) plates. N.B. Both silica and glass absorb strongly in the i.r. and cannot therefore be used; the best transparent material is NaCl but it is very brittle and dissolves in water. The rock salt plates must be washed clean with dry CH2Cl2.
Solids can be finely ground and mixed with Nujol (liquid parrafin). The resulting "mull" is then sandwiched between plates as for liquids. The spectrum obtained contains bands due to the Nujol; these must be noted and taken into consideration.
The best way to examine organic compounds, when possible, is as a solution in a non-polar solvent; CCl4 and CS2 are very commonly used - they have reasonable transmission ranges at 1mm cell thickness which are complementary.
Whenever solution cells are used, a compensating cell containing an equal thickness of solvent is necessary in the reference beam. The recorded spectrum is then that of the solution minus the solvent, and, providing the path-length through each cell is closely similar, this will be the spectrum of the solute (except in those regions where the solvent absorbs most strongly).
The principle points to appreciate are that the position at which a band occurs depends primarily on the mass of the atoms attached to the bond and the strength of the bond. The greater the mass, the lower the wavenumber; the stronger the bond, the higher the wavenumber. It takes more energy to stretch a bond than to bend a bond, so bands due to stretching occur at higher wavenumbers than bending vibrations (also termed deformations). The intensity of a band depends upon how many groups of a particular type exist, the magnitude of the dipole moment within the functional group, how much the dipole moment changes within the molecule when it vibrates and related to this, the symmetry of the molecule. As a general guide, the greater the number of groups of a particular type and the more polar the bond, the more intense the band. You may now choose to view some assorted IR spectra of various organic molecules if you wish.
Bristol University Homepage For Bristol University Students
Bristol University School Of Chemistry
Infra-red Spectroscopy- Contents