There are relatively few reports of measurements for solution spectra of caeruloplasmin which give pictures. The examples here were obtained during the study of the possible connection between caeruloplasmin, homocysteine, and vein graft failure.

EPR spectrum of bovine caeruloplasmin in NaCl/OAc buffer, pH=7.1, (Sigma C2026), measured in a sealed-off Pasteur pipette at 294K. X-band at 9.77GHz, on Bruker ESP300E at Bristol, 530 scans
Displays all via Bruker WinEPR {Shareware, version 2.11}
The spectrum shows four resonances, as expected from the nuclear spin of the copper, at 316.0, 322.8, 330.3 and 338.3 mT; these give a g-factor of about 2.12 and a hyperfine splitting of about 7.5mT. Careful inspection of the spectrum shows that the largest peak has some additional fine structure with a hyperfine splitting of about 1mT. This must be 14N (I=1) splitting showing that the coppers are coordinated to 2 to 3 nitrogens. There is an additional signal at 348.7mT whose assignment is more problematic, but must also be associated with Cu(II). The very assymetric shape of the spectrum (the linewidths vary with the copper isotope spins) is due to the protein structure surrounding the coppers preventing them moving freely in the solution. Remember that the glycoprotein has a molecular mass of around 132kD, so that it does not tumble around rapidly in the solution as would a small copper complex. This causes line broadening of the four components which is dependent on the spin state (I = -3/2, -1/2, 1/2, 3/2), the anisotropy in the g-value and the A-values, and the tumbling rate in the solution. In fact, the observation of any spectrum in solution for such a large complex is surprising, and it implies that the Cu(II) groups that we observed here have quite a lot of freedom of movement with the structure.
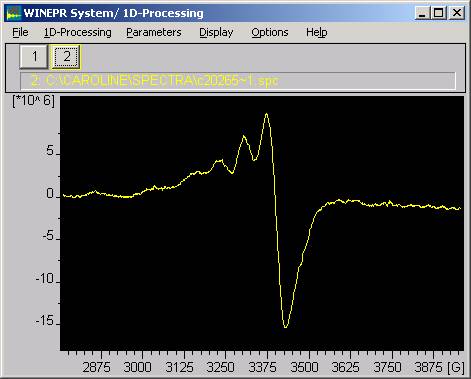
The spectrum varies with different samples! There are two labile coppers in the pdb data. An observation consistent with the instability of ceruloplasmin samples. Thus another batch of caeruloplasmin gave a different spectrum in which the additional signal at 348.7mT is absent, and, more important, some extra absorptions are visible to low field. Examination of these shows that they have a hyperfine splitting (g-parallel) of around 1600mT, consistent with a T2 Cu(II). Moreover, the Cu(II) now appears in an apparently glassy spectrum. The caeruloplasmin molecule can only move slowly in solution due to its large size, giving a very long correlation time, so the spectrum looks like that for a frozen glass.
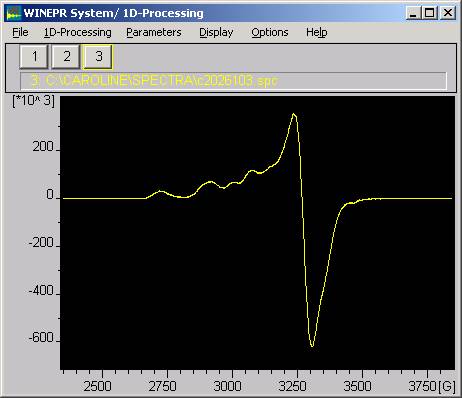
EPR spectrum of bovine caeruloplasmin in frozen NaCl/OAc buffer, pH=7.1, (Sigma C2026), measured at 100K. X-band at 9.5GHz, on Bruker ESP300E at Bristol
Now it is possible the see evidence for both T1 and T2 coppers, the latter with a g-parallel component of about 800mT.This is a preliminary report of otherwise unpublished data, and we welcome comments and questions.