Chapter 8
Temperature modulated open circuit potential spectroscopy
8.1. Introduction
Kinetic
studies of fast chemical reactions, e.g. the neutralisation in aqueous solution
of strong acid by strong base that has a half-life of 10-6 s-1
or less, under ordinary conditions are difficult to characterise using
conventional kinetic techniques. For fast processes it is difficult to
deconvolute the chemical and mixing kinetics. These technical problems have
been overcome by the development of a group of methods known as relaxation
methods. The pioneer worker in this field was Manfred Eigen 1. Relaxation methods differ fundamentally from the
conventional kinetic methods in that the system is initially at equilibrium
under a given set of conditions. These conditions are suddenly changed; the
system is no longer at equilibrium, and it relaxes to a new state of
equilibrium. The speed with which it relaxes can be measured and the rate
constants can be obtained.
There
are various ways in which the conditions are disturbed. One possibility is
changing the hydrostatic pressure. Another approach is to increase the
temperature suddenly, usually by the rapid discharge of a capacitor. This
method is called the temperature jump or T-jump method. It is possible to raise
the temperature of a tiny cell containing a reaction mixture by a few degrees
in less than 10-7 s, sufficiently rapid to permit the study of fast
chemical processes 1-3.
A
few groups studying electrochemical process, e.g., mass transport, charge
transfer reactions and adsorption processes, have employed the temperature jump
method at electrodes. Gründler et al. 4-29 used dc electrical heating to perform electrochemical
experiments. Many assumptions were taken in these studies the main one being
that the heat is only perturbing the temperature of the electrode, the rest of
the system remaining constant. In the experimental conditions, the heating up
of the solution created a gradient of temperature from the warm areas to the
cold areas of the electrolyte. The gradient of temperature originated a
gradient of concentration close to the source of heating making non-homogeneous
conditions in the solution. Other significant effects to be considered were the
convective flow that was originated when in stationary conditions two parts of
a liquid were at different temperatures. Heating system generated noise in the
electrochemical measurements of the electrode. Results were hardly dependent on
convection and gradients of temperature and concentration. Pure temperature
effects cannot be deconvoluted easily from the results suggesting that the
temperature jump of the electrode was not very precise. Valdes and Miller 30-32 described a quantitative analysis of thermal
modulation voltammetry, modifying the experimental methodology using a laser as
heating source. A laser beam heated the absorptive back of a think platinum
disk mounted in a glass cell. The beam was chopped between 5 Hz and 10 Hz. The
periodic change in the temperature produced a current modulation that was
recorded during a controlled potential scan. From the rotation speed of the
disk and the modulated current data it was possible to obtain the temperature
coefficients necessary to describe the changes in temperature. The Valdes and
Miller method that quantifies the temperature perturbation in terms of
engineering parameters (flux of solution, Reynolds’s number, etc). Valdes and
Miller in their experimental set-up heated the electrode but at the same time
the electrochemical solution. They did not consider the Soret effect (the
change in the distribution of ions due to the temperature induced formation of
a free energy gradient) which is a critical parameter when the solution is
heated. The heat lost by the backing medium (in this case the spindle used to
rotate the platinum disk) was not considered. These facts suggest the results
obtained are not very precise.
Olivier
et al. 33 employed a temperature jump method to perform
electrochemical impedance measurements. Following the Valdes idea, an infrared
diode was used as heating source. This
infrared diode was modulated in a sine wave. The infrared beam irradiated the working
electrode through a prismatic glass cell. From the electrochemical impedance
measurements the thermoelectrochemical transfer functions were obtained to
describe the system.
Gabrielli
et al. 34, 35 investigated electrochemical impedance measurements
using the temperature jump method for heterogeneous reaction mechanisms.
Gabrielli suggested that many processes were controlled by the transport of the
charged particles. The studies considered the Soret effect, assuming low
temperature gradients. It was argued that in dilute solutions the low
temperature gradient result in a very low concentration gradient and hence a
negligible Soret effect. Under these conditions the temperature distribution
could be assumed to be controlled by the thermal diffusion equation. The
electrochemical system could be described by the thermal diffusion equation.
This method assumed a constant temperature gradient during the diffusion
process that is not very realistic approximation. Another misconception of the
theory was that the temperature coefficient of the reference electrode
potential, which is important in the kinetic region, was under estimated. Again
the background medium of the electrode was neglected.
Rotenburg
36, 37 overcame Gabrielli’s problem with respect to the
reference electrode and developed a new method to perform thermoelectrochemical
impedance. Again in these studies a laser was chosen as the source of heat. The
electrode potential was controlled and swept by a potentiostat and the ac
response recorded by a frequency response analyser. Considering the phase angle
and the ac current responses, the method describes in detail the system. A
problem of this methodology was that the electrode was illuminated through the
solution.
The
aim of this chapter is to develop temperature modulated open circuit potential
spectroscopy. This new technique overcomes the problems of the solution
heating. A diamond heat sink is introduced as electrode backing medium to
adsorb all the heat from the electrode and not allow the heating of the
solution, hence reducing the Soret effect to negligible values. The backing
medium is now considered as a relevant element in the method. The sine wave
modulation of the heating source (infrared diode) allows better control and
more precise analysis of the electrochemical system. The backing medium
(diamond) is transparent to infrared illumination avoiding the need to pass the
beam through the solution. It is demonstrated how this method allows impedance
studies to be performed over a wide range of frequencies because there is no
influence of the electrical elements in this new technique. Normally impedance
depends on the bandwidth of the potentiostat and frequency response analysers
used in the experiment.
8.2. Theory
The electrochemical system employed in these studies has not been described before and requires a new theoretical development to establish how the changes in the temperature of the electrode modify the total potential of the cell. This section is divided in two to simplify the theoretical approach. Firstly it is considered how the light intensity influences the change in the temperature of electrode; secondly the change in temperature is related to the change in the total potential of the electrochemical cell.
8.2.1. Relationship
between light intensity and the electrode temperature
The diagram below shows the
system to be considered:

Figure 8.1. Schematic diagram of the system
diamond-gold / electrolyte
It is assumed that the gold
layer is infinitely thin, i.e. it can be assumed that temperature (T) is
uniform on the electrode surface.
The Fick’s laws of heat
transport are:
![]()
![]() J is heat flux [equation 8.1]
J is heat flux [equation 8.1]
 [equation 8.2]
If at the gold surface (x=0)
it is assumed that all the incident light is converted to heat:

[equation 8.3]
where I(t) is the photon flux at time t
and e is the energy of a single
photon.
To continue it is necessary
to make a further assumption corcerning the system. It is assumed that diamond
is heated infinitely quickly on the experimental time scale. Hence the
gold/diamond system is of uniform temperature.
Hence
Jx=0 = 0 Þ
![]() [equation 8.4]
[equation 8.4]
Equation 8.1 may be solved
for the semi-infinite boundary conditions:
At t=0 T= Ta
for all x
[equation 8.5]
At all t T= Ta
for x®¥
[equation 8.6]
For positive x , the Laplace transform of equation
8.2 with respect to t is
 [equation
8.7]
Applying the boundary condition
from equation 8.5 yields:
 [equation
8.8]
which rearranges to:
 [equation
8.9]
Equation 8.9 is of the form:
![]() [equation
8.10]
[equation
8.10]
for which the Laplace
transform is:
![]() [equation 8.11]
[equation 8.11]
or
![]() [equation
8.12]
[equation
8.12]
Setting s=0 indicates:
![]() [equation
8.13]
[equation
8.13]
and therefore
![]() [equation 8.14]
[equation 8.14]
The inverse of equation 8.14
is:
![]() [equation 8.15]
[equation 8.15]
Hence equation 8.9 may be written
 [equation 8.16]
The Laplace transform of the
boundary condition from equation 8.6 is:
![]() at x ®¥
at x ®¥
[equation 8.17]
So
B=0 [equation 8.18]
And hence
 [equation 8.19]
Differentiating equation
8.19 with respect to x yields:
 [equation
8.20]
which at x=0 is
![]()
 [equation
8.21]
Laplace transform of the
boundary conditions from the equation 8.4 gives:
 [equation 8.22]
Comparing equations 8.21 and
8.22 results in
 [equation 8.23]
which when substituted in
the equation 8.19 at x=0 gives
 [equation 8.24]
Laplace inversion using
convolution theory results in:
 [equation 8.25]
 ![]()
For a system subject to a
modulation
![]() [equation 8.26]
[equation 8.26]
The steady-state AC response
is:
 [equation 8.27]
If g = U2 Þ dg = 2UdU
ß
 [equation 8.28]
Remembering that
 [equation
8.29]
gives
 [equation 8.30]
Reordering, this final
expression yields:
 [equation 8.31]
i.e. the modulated temperature lags the modulated intensity by 45o.
8.2.2. Relationship
between the temperature and the open circuit potential
Considering the equivalent
circuit shown below:

Figure 8.2. Equivalent circuit diagram
DVj is defined as the junction
potential between the (hot) electrode and the (cold) contact wire
![]() [equation 8.32]
[equation 8.32]
For small T changes bj is constant. Therefore:
![]() [equation 8.33]
[equation 8.33]
DVs is
the change in potential due to the Soret effect
![]() [equation 8.34]
[equation 8.34]
For small T changes bs
is constant. Therefore:
![]() [equation
8.35]
[equation
8.35]
The Soret effect looks after
the change in the distribution of ions in solution due to the temperature
induced formation of a free energy gradient. The Soret potential is analogous
to a junction potential. It should be noted that the ions responsible for the
Soret effect are those of the background electrolyte and not the electroactive
species. J.F. Smalley et al. 38 indicate that the Soret
potential is established in nanoseconds, i.e. DVs follows any temperature
change.
DVf is the change in potential of the redox couple due to the change of
temperature
![]() [equation 8.36]
[equation 8.36]
For small T changes bf is constant. Therefore:
![]() [equation 8.37]
[equation 8.37]
Now considering that
![]() [equation 8.38]
[equation 8.38]
where C’ is the integrated capacitance between Vi and the open circuit potential or potential of zero
charge (pzc), for a small changes in T:
 [equation 8.39]
 [equation 8.40]
Differentiating equation
8.38 with respect to Vi
gives:
 [equation 8.41]
as  where C is the differential capacitance
this can be written as
 [equation 8.42]
Reordering equation 8.42
yields
 [equation 8.43]
and substituting in the
denominator of equation 8.40 gives
 [equation 8.44]
Substituting the equation
8.38 into equation 8.44
![]() [equation 8.45]
[equation 8.45]
If the change of temperature
is small:
![]() [equation 8.46]
[equation 8.46]
where ![]() [equation 8.47]
[equation 8.47]
The measured potential
change is:
![]() [equation 8.48]
[equation 8.48]
Substituting equations 8.33,
8.35 and 8.46 into the equation 8.48 gives:
![]() [equation 8.49]
[equation 8.49]
and if on the time scale of
the experiment bi is
independent of time differenciating results in:
![]() [equation 8.50]
[equation 8.50]
where jDL
is the current across the capacitor. As the net current must be zero under open
circuit potential condition, Kirchoff’s law indicates jDL = -jF , where jF is the Faradaic current flowing. If the Faradaic
impedance, Z, is independent of T (electron transfer at OHP) then the
voltage drop across the Faradaic component is DVF
= jF Z + DVf. As the Faradaic component
is parallel to the double layer DVF = DVi then DVi = - jDL Z + DVf.
Hence:
 [equation 8.51]
Substituting for Vi using equation 8.48:
![]() [equation 8.52]
[equation 8.52]
and rearranging equation
8.52 yields
![]() [equation 8.53]
[equation 8.53]
Equation 8.53 shows the
relationship between DVT and the
temperature.
8.3. Experimental set-up
Electrochemical experiments were performed using a two electrode
system. This section descibes the apparatus used.
8.3.1. Electrolyte
solutions
18.3 MW cm ultrapure deionised water (Millipore) was used as solvent and 0.1 mol
dm-3 sulfuric acid (H2SO4) as supporting
electrolyte.
Different solutions were prepared contaning:
·
1´10-3
mol dm-3 of potasium ferricyanide (K3Fe(CN)6)
/ 1´10-3 mol dm-3 of potasium ferrocyanide (K4Fe(CN)6)
in 0.5 mol dm-3 H2SO4
in H2O.
·
0.1´10-3 mol dm-3 of potasium ferricyanide (K3Fe(CN)6)
/ 0.1´10-3 mol dm-3 of potasium ferrocyanide (K4Fe(CN)6)
in 0.5 mol dm-3 H2SO4
in H2O.
·
1´10-3
mol dm-3 of ferrosulfate (Fe2SO4) / 1´10-3 mol dm-3 of ferricsulfate (Fe2(SO4)3)
in 0.5 mol dm-3 H2SO4
in H2O.
·
0.1´10-3 mol dm-3 ferrosulfate (Fe2SO4)
/ 0.1´10-3 mol dm-3 of ferricsulfate (Fe2(SO4)3)
in 0.5 mol dm-3 H2SO4 in H2O.
Glassware
was cleaned with a five step process (for further details see section 5.3.1)
All the solutions were purged with standard laboratoy grade
oxygen-free argon (Ar) for aproximmately 30 minutes before any electrochemical
experiment was performed.
8.3.2. Characteristics of the
substrates
The substrate used for these studies was quartz. Samples were already cut and supplied in pieces of 1 cm2 (1 cm ´ 1 cm) with 1 mm thickness. Normal pre-treatment procedure was applied before the growth stage (see chapter 2 for further details). Quartz was used as a substrate because it allows the growth of diamond in such conditions that the final samples were transparent a requirement essential for the electrodes in these studies.
8.3.3. Growing
characteristics of the samples
Diamond deposition was
performed for seven hours, giving a film thickness of approximately 5 mm. Films were cooled in the chamber under a
hydrogen atmosphere. Films were transparent. The quality of the diamond was
assessed using Raman spectroscopy and scanning electron microscopy, sem (check chapter 2 for further
details).
8.3.4. Electrode construction and cell assembly
Approximately 40 nm of chromium were deposited in a 0.4 cm diameter circle on top of a 1 cm ´ 1 cm diamond sample. This was followed by approximately 300 nm of gold (see figure 8.3.a). The sample was then attached to a glass tube using the following method. A piece of a single wire (approximately six centimetres long) was attached to the edge of the sample with silver conducting paint (see figure 8.3.b). After drying the wire was coated with araldite to protect the electrical contact (see figure 8.3.c). A glass tube whose end was of the same diameter (external one, see figure 8.4) as the gold area was sealed to the diamond sample using silicon rubber sealant (see figure 8.3.d and 8.3.e). The electrode was left to dry for 24 hours.
The cell was completed with a counter electrode. It was secured through a plastic moulding that rested on top of the glass tubing. In figure 8.3 a schematic diagram of the contact is shown.

Figure 8.3. Schematic diagram of the different stages
in the construction of the electrical contact and the cell assembly (note that
the diagram is not to scale). a) After gold deposition; b) attachment of the
single wire; c) protection of the contact with araldite resin d) placement of
the glass tube; e) sealed of the glass tube to the diamond sample using silicon
rubber sealant.

Figure 8.4. Detailed diagram of the glass cell used in these studies
8.3.5. Counter Electrodes
The counter electrodes have
been described in section 5.3.3.
8.3.6. Reference electrode
A platinum wire was used as
a pseudo reference electrode in these studies when a three-electrode mode
configuration was required.
8.3.7. Faraday Cages
Faraday Cages have been
described in section 7.2.6.
8.3.8. Electronic equipment used in these studies
A light beam from 5mW infra
red diode source was focused on the back of the gold diamond electrode. The
light beam was modulated at variable frequencies using a lock in amplifier
(Standford Research Systems Model SR830 DSP). The lock in amplifier fed an ac (0.75
V) and dc (4.25V) sinusoidal component to the infrared diode. The fraction
modulated in the light was 10%. After the beam irradiated the gold diamond
electrode the electrochemical response in ac and dc terms (in voltage) was
analysed by the lock in amplifier. For each frequency used in the experiment,
phase angle and voltage responses at open circuit potential conditions were
recorded. The electrochemical glass cell operated in two electrode mode (gold
diamond electrode as working electrode and a platinum counter electrode as
reference electrode/counter electrode) (see figure 8.3). The cell assembly was
housed in a Faraday cage to avoid any stray light or electrical pickup from
external sources.
Cyclic voltammograms
measurements were performing using EG&G Princeton Applied Research
Potentiostat/Galvanostat Model 273; controlled using Research Electrochemistry
software (version 4.3).
Impedance measurements were performed using a Solartron 1286 potentiostat and a Solartron 1250 Frequency Response Analyser (FRA). The instruments were controlled using Z-plot software. In all ac experiments modulation amplitude of 10 mV was applied.

Figure 8.5. Experimental temocps display
8.4. Cyclic voltammograms
The cell was operated in three-electrode mode configuration to record the cyclic voltammograms (adding a platinum wire electrode to the usual two-electrode mode described in other sections).
An i-E curve for a gold (on
diamond substrate) electrode immersed in the
1´10-3 mol dm-3
of potassium ferrocyanide (K4Fe(CN)6)/ 1´10-3 mol dm-3 of
ferricyanide (K3Fe(CN)6) in 0.5 mol dm-3 H2SO4
aqueous solution is shown in the figure 8.6.

Figure 8.6. A cyclic voltammogram recorded at gold (on
diamond substrate) electrode immersed in 1´10-3 mol dm-3
of potassium ferricyanide (K3Fe(CN)6)/ 1´10-3
mol dm-3 of potassium ferrocyanide (K4Fe(CN)6)
in 0.5 mol dm-3 H2SO4 aqueous solution. The i-E
curve was recorded at scan rate of 0.1 V s-1.
The curve shows a reversible reduction peak at -0.12 V and a reversible oxidation peak at 0.09 V that correspond with the formation of the species Fe(CN)64- / Fe(CN)63- respectively. The behaviour observed is the typical for the reduction of K3Fe(CN)6/K4Fe(CN)6 in aqueous solvent. The magnitude in the differences between peaks (0.21 V) can be explained by the fact that the cyclic voltammogram was recorded in absence of iR compensation.
An i-E curve for a gold (on diamond substrate) electrode immersed in
the 0.1´10-3 mol dm-3
of ferricsulfate (Fe2(SO4)3)/ 0.1´10-3 mol dm-3 of
ferrosulfate (FeSO4 ) in 0.5 mol dm-3 H2SO4
aqueous solution is shown in the figure 8.7.
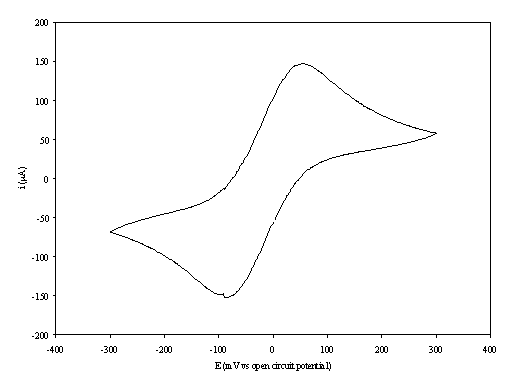
Figure 8.7. A cyclic voltammogram recorded at gold (on
diamond substrate) electrode immersed in 0.1´10-3 mol dm-3
of ferricsulfate (Fe2(SO4 )3)/ 0.1´10-3
mol dm-3 of ferrosulfate (FeSO4 ) in 0.5 mol dm-3
H2SO4 aqueous solution.
The i-E curve was recorded at scan
rate of 0.1 V s-1.
The curve shows a reversible reduction peak at -0.09 V and a reversible oxidation peak at 0.06 V that correspond with the formation of the species Fe+2/ Fe+3 respectively. The behaviour observed is the typical for the reduction of FeSO4/Fe2(SO4)3 in aqueous solvent. The magnitude in the differences between peaks (0.15 V) can be explained by the fact that the cyclic voltammogram was recorded in absence of iR compensation.
An i-E curve for a gold (on
diamond substrate) electrode immersed in the 1´10-3 mol dm-3
of ferricsulfate (Fe2(SO4 )3)/ 1´10-3 mol dm-3 of
ferrosulfate (FeSO4 ) in 0.5 mol dm-3 H2SO4
aqueous solution is shown in the figure 8.8.

Figure 8.8. A cyclic voltammogram recorded at a gold
(on diamond substrate) electrode
immersed in 1´10-3
mol dm-3 of ferricsulfate (Fe2(SO4 )3)/
1´10-3 mol dm-3
of ferrosulfate (FeSO4 ) in 0.5 mol dm-3 H2SO4
aqueous solution. The i-E curve was recorded at scan rate of
0.1 V s-1.
The curve shows a reversible reduction peak at -0.10 V and a reversible oxidation peak at 0.07 V that correspond with the formation of the species Fe+2/ Fe+3 respectively. The behaviour observed is the typical for the reduction of FeSO4/Fe2(SO4)3 in aqueous solvent. The magnitude in the differences between peaks (0.17 V) can be explained by the fact that the cyclic voltammogram was recorded in absence of iR compensation.
These cyclic voltammograms were recorded before any ac experiments or temopcs experiments to ensure that the electrodes were functioning correctly.
8.4. Ac impedance experiments
All ac impedance experiments were recorded using a 10 mV ac modulation. The frequency range was between 65 KHz and 0.01 Hz using a scale of 7 steps per decade. The cell was operated in three-electrode mode.
Figures 8.9, 8.10 and 8.11 describe the ac impedance behaviour of 1´10-3 mol dm-3 of potasium ferricyanide (K3Fe(CN)6) / 1´10-3 mol dm-3 of potasium ferrocyanide (K4Fe(CN)6) in 0.5 mol dm-3 H2SO4 in H2O.

Figure 8.9. Imaginary component (Z²) against real part (Z¢) of the impedance for 1´10-3 mol dm-3 of potasium ferricyanide (K3Fe(CN)6) / 1´10-3 mol dm-3 of potasium ferrocyanide (K4Fe(CN)6) in 0.5 mol dm-3 H2SO4 in H2O. The ac modulation was 10 mV. Frequency range was between 65 KHz and 0.01 Hz. In the inset plot it can be appreciated better the shape of the semicircle at high frequencies.
A semicircle for high frequencies is observed. In medium and low frequencies the basic behaviour of the impedance is linear. This plot is in agreement with the Randles equivalent circuit. The semicircle region at high frequencies corresponds with the frequency region where all the non-charging current may be reported by an ohmic resistance. This behaviour is described by the equation:

[equation 8.54]
where Z¢ an Z² are the real and the imaginary component of the impedance respectively; RW is the ohmic solution resistance; Rct is the charge transfer resistance at the electrode. The equation 8.54 allows by extrapolation of the semicircle in the plot the calculation of the value of the Rct and RW. The maximum in the semicircle occurs at , hence full analysis of the semicircle allows the interfacial capacitance to be determined.
![]()
At low frequencies there is a diffusion controlled electrode process. In this process the main characteristic is the linear correlation of Z¢ and Z². This linear behaviour is described by the following equation:
![]()
[equation 8.55]
where Cd is the differential capacitance of the double layer; s is an experimental parameter that can be calculated from the following equation:

[equation 8.56]
where T is the temperature; R the gas constant; n is the number of electrons exchanged in the electrochemical process; A is the exposed area of the electrode; DO and DR are the diffusion coefficients for the oxidise and reduced form of the redox couple respectively; CO* and CR* are the concentrations of the oxidise and reduced form of the redox couple at the equilibrium stage.

Figure 8.10. Phase component (DEG) against frequency (Hz) for 1´10-3 mol dm-3 of potasium ferricyanide (K3Fe(CN)6) / 1´10-3 mol dm-3 of potasium ferrocyanide (K4Fe(CN)6) in 0.5 mol dm-3 H2SO4 in H2O. The ac modulation was 10 mV. Frequency range was between 65 KHz and 0.01 Hz. The frequency is in a logaritmic scale.
There is a change in phase in the region between 100 Hz and 1000 Hz. This region relates the exchange of an electron in the redox couple.
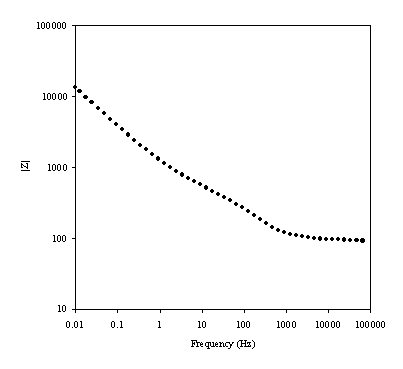
Figure 8.11. Magnitude against frequency (Hz) for 1´10-3
mol dm-3 of potasium ferricyanide (K3Fe(CN)6)
/ 1´10-3
mol dm-3 of potasium ferrocyanide (K4Fe(CN)6)
in 0.5 mol dm-3 H2SO4
in H2O. The ac modulation was 10 mV. Frequency range was between 65
KHz and 0.01 Hz. The frequency and the magnitude axes are in a logaritmic
scale.
Figures 8.12, 8.13 and 8.14 describes the ac impedance behaviour of 0.1´10-3 mol dm-3 of potasium ferricyanide (K3Fe(CN)6) / 0.1´10-3 mol dm-3 of potasium ferrocyanide (K4Fe(CN)6) in 0.5 mol dm-3 H2SO4 in H2O.
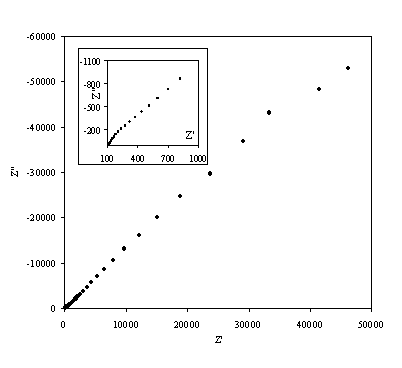
Figure 8.12. Imaginary component (Z²) against real part (Z¢) of the impedance for 0.1´10-3 mol dm-3 of potasium ferricyanide (K3Fe(CN)6) / 0.1´10-3 mol dm-3 of potasium ferrocyanide (K4Fe(CN)6) in 0.5 mol dm-3 H2SO4 in H2O. The ac modulation was 10 mV. Frequency range was between 65 KHz and 0.01 Hz. In the inset can be appreciated better the shape of the semicircule at high frequencies.
A very similar behaviour is observed in figure 8.12 as figure 8.9.
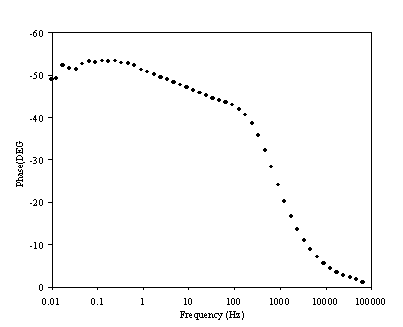
Figure 8.13. Phase component (DEG) against frequency (Hz) for 0.1´10-3 mol dm-3 of potasium ferricyanide (K3Fe(CN)6) / 0.1´10-3 mol dm-3 of potasium ferrocyanide (K4Fe(CN)6) in 0.5 mol dm-3 H2SO4 in H2O. The ac modulation was 10 mV. Frequency range was between 65 KHz and 0.01 Hz. The frequency is in a logaritmic scale.
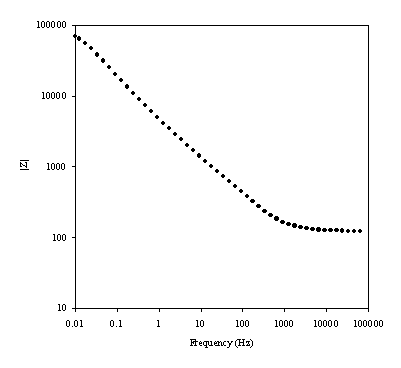
Figure 8.14. Magnitude against frequency (Hz) for 0.1´10-3 mol dm-3 of potasium ferricyanide (K3Fe(CN)6) / 0.1´10-3 mol dm-3 of potasium ferrocyanide (K4Fe(CN)6) in 0.5 mol dm-3 H2SO4 in H2O. The ac modulation was 10 mV. Frequency range was between 65 KHz and 0.01 Hz. Frequency and magnitude axes are in a logaritmic scale.
The change in phase behaviour between figures 8.10 and 8.13 can be analysed in terms of change in charge transfer resistant. Rct is given by
![]()
[equation 8.57]
where i0 is defined by
![]()
[equation 8.58]
n is the number of electrons involved in the electron transfer (in this case just one), A is the area of the working electrode, k0 is the standard rate constant that indicates the kinetic facility of the redox couple and a is the transfer coefficient that varies between one and zero. As the concentration of the redox couple is the same for both ions, equation 8.58 becomes
![]() [equation 8.59]
[equation 8.59]
If the concentration of the redox couple is reduced by one order of magnitude, the charge transfer resistance is increased as it depends on the inverse of the concentration. A higher charge transfer resistance leads to the maximum in the semicircle occurring at lower frequency. The change in the phase behaviour displayed in figures 8.10 and 8.13 is therefore explained.
Little difference is observed between the date in figure 8.11 and in figure 8.14.
Figures 8.15,
8.16 and 8.17 describe the ac impedance behaviour of 0.1´10-3 mol dm-3
of ferricsulfate (Fe2(SO4 )3)/ 0.1´10-3 mol dm-3 of
ferrosulfate (FeSO4 ) in 0.5 mol dm-3 H2SO4
aqueous solution.
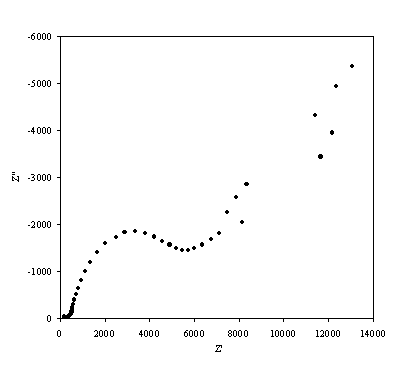
Figure 8.15. Imaginary component (Z²) against real part (Z¢) of the impedance for 0.1´10-3 mol dm-3 of ferricsulfate (Fe2(SO4 )3)/ 0.1´10-3 mol dm-3 of ferrosulfate (FeSO4 ) in 0.5 mol dm-3 H2SO4 aqueous solution. The ac modulation was 10 mV. Frequency range was between 65 KHz and 0.01 Hz.
A well defined semicircle is shown in the high frequency region in accordance with the theory. In the diffusion controlled region there is a not very well defined straight line.
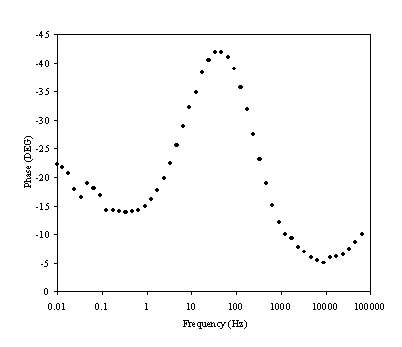
Figure 8.16. Phase component (DEG) against frequency (Hz) for 0.1´10-3 mol dm-3 of ferricsulfate (Fe2(SO4 )3)/ 0.1´10-3 mol dm-3 of ferrosulfate (FeSO4 ) in 0.5 mol dm-3 H2SO4 aqueous solution. The ac modulation was 10 mV. Frequency range was between 65 KHz and 0.01 Hz. Frequency axe is in a logaritmic scale
There is a change in phase in the region between 1 Hz to 1000 Hz. This region relates the exchange of an electron in the redox couple.
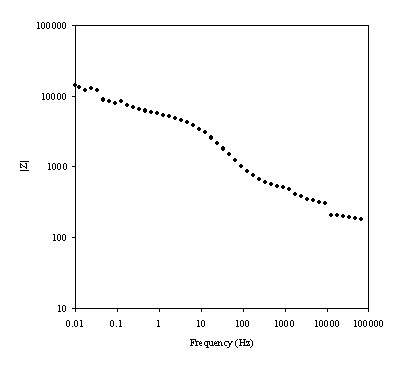
Figure 8.17. Magnitude against frequency (Hz) for 0.1´10-3 mol dm-3 of ferricsulfate (Fe2(SO4 )3)/ 0.1´10-3 mol dm-3 of ferrosulfate (FeSO4 ) in 0.5 mol dm-3 H2SO4 aqueous solution. The ac modulation was 10 mV. Frequency range was between 65 KHz and 0.01 Hz. Magnitude and frequency axes are in a logaritmic scale.
8.5. Temperature modulation open circuit potential experiments
Pre-eliminary experiments indicate that the optimal conditions to commission temperature modulation open circuit potential experiments using the set up explained in the section 8.3.7 is to utilise the less concentrated ferrosulfate/ferricsulfate redox couple.
The experimental set up allows a study of a small range of frequency, approximately between 0.01 Hz and 4 KHz. When bigger values to 4 KHz were reached the signal was so noisy that signal could not be recovered. This limitation was related with the power of the infra red diode. Due to the limitation in the frequency region to be studied the couple to be chosen should have a change in phase in the region that can be measured. After checking all the plots related to the phase change as a function of the frequency (see figures 8.10, 8.13 and 8.16) the conclusion is that only ferrosulfate / ferricsulfate redox couple is in the range of the set up. The reason to use the less concentrated solution is that when the concentration is low the quality of the signal (less noise in the measurements) from the cell is optimal and much better defined plots can be obtained.
Figures 8.18, 8.19 and 8.20 describe the temperature modulation open circuit potential behaviour of 0.1´10-3 mol dm-3 of ferricsulfate (Fe2(SO4)3)/0.1´10-3 mol dm-3 of ferrosulfate (FeSO4) in 0.5 mol dm-3 H2SO4 aqueous solution.

Figure 8.18. Imaginary component (Z²) against real part (Z¢) of the temperature modulation open circuit experiment for 0.1´10-3 mol dm-3 of ferricsulfate (Fe2(SO4 )3)/ 0.1´10-3 mol dm-3 of ferrosulfate (FeSO4 ) in 0.5 mol dm-3 H2SO4 aqueous solution. Frequency range was between 4 KHz and 0.01 Hz. The inset details the shape of the semicircle at high frequencies.
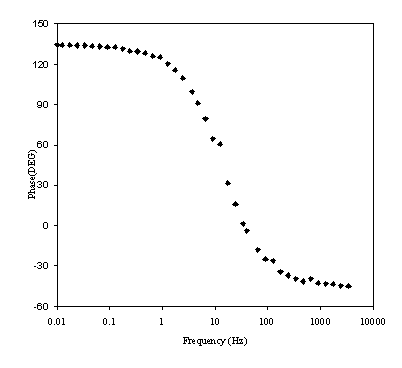
Figure 8.19. Phase component (DEG) against frequency (Hz) for 0.1´10-3 mol dm-3 of ferricsulfate (Fe2(SO4 )3)/ 0.1´10-3 mol dm-3 of ferrosufhate (FeSO4 ) in 0.5 mol dm-3 H2SO4 aqueous solution. Frequency range was between 4 KHz and 0.01 Hz. Frequency axe is in a logarithmic scale.
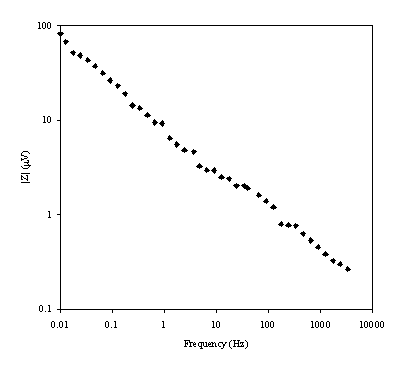
Figure 8.20. Magnitude (mV) against frequency (Hz) for 0.1´10-3 mol dm-3 of ferricsulfate (Fe2(SO4 )3)/ 0.1´10-3 mol dm-3 of ferrosulfate (FeSO4 ) in 0.5 mol dm-3 H2SO4 aqueous solution. Frequency range was between 4 KHz and 0.01 Hz. Magnitude and frequency axes are in a logarithmic scale.
Figure 8.18 shows a straight line very close to 45 degrees that suggests a diffusion process or composition of two similar electrochemical stages. Figure 8.19 suggests a possible change in phase between 1 Hz and 1000 Hz.
For further analysis of the temocps results adaptation in the mathematical developed done in section 8.2 to the experimental set-up is required.
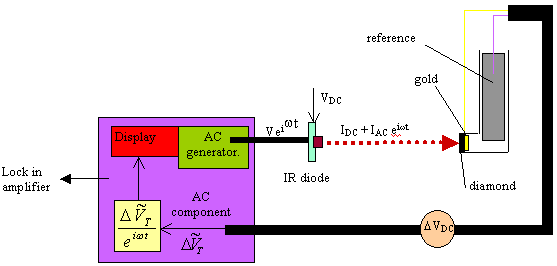
Figure 8.21. Diagram of the experimental set up that
details the ac and dc components in the system.
From equation 8.31:

Considering that the diamond samples used as substrates were estimated to be about 5 mm thick and the fact that the diamond samples were polycrystalline rather than single crystal all constants to be included where placed in a new experimentally adjustable parameter rD :
 [equation 8.60]
Differentiating the above equation
 [equation
8.61]
Substituting equations 8.60 and 8.61 into equation 8.53:

[equation 8.62]
To solve equation 8.62 only the ac component is considered. The aim is to link the total voltage change with the applied frequency in the experimental conditions:
Supposing that the total voltage change is due to pure ac component then
![]() where B is an arbitrary
parameter [equation 8.63]
where B is an arbitrary
parameter [equation 8.63]
Differentiating equation 8.63 with respect to t yields:
![]() [equation 8.64]
[equation 8.64]
Substituting the equations 8.63 and 8.64 into equation 8.62 gives

[equation 8.65]
Rearranging yields

[equation 8.66]
Therefore:

![]() [equation 8.67]
[equation 8.67]
The lock in measures hence:

[equation 8.68]
If bj and bs are small:
 [equation 8.69]
If no diffusion is observed
Z = Rct Rct: charge transfer resistance [equation 8.70]
If diffusion is observed
 [equation 8.71]
where s is defined in equation 8.56.
Mathcad 8 Profesional
(MathSoft, Inc.) was operated to fit the equation 8.69 in diffusion conditions
with the experimental data (figures 8.18, 8.19 and 8.20) Parameters for the
equation 8.69 were taken from different sources.
Parameters for the gold (on diamond substrate) electrode:

· Values of C (capacitance) and RF (faradaic resistance) are from the average of experimental impedance.
· Values of constants like F (faraday), DR and DO (diffusion coefficients), R (constant of gases) are from CRC handbook 39; bi is from Smalley et al. 38.
· Values of T (temperature), CO and CR (concentration of the redox species) and Agold (gold area on diamond electrode) are from the experimental conditions.
· Parameter, bf, is adjusted to give phase shift in frequency plot at correct place.
· Parameter, r, acts as a scalar to fit the theoretical data with the experimental one.
All parameters are in SI units.
Calculating s

Plots:
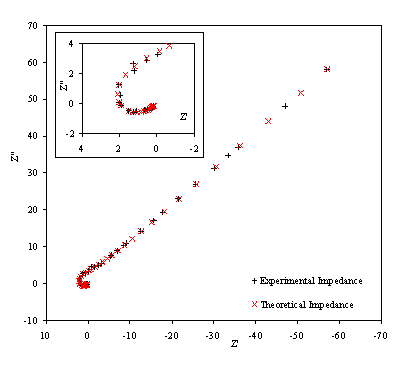
Figure 8.22. Imaginary component (Z²) against real part (Z¢) of the temperature modulation open circuit for 0.1´10-3
mol dm-3 of ferricsulfate (Fe2(SO4 )3)/
0.1´10-3 mol dm-3
of ferrosulfate (FeSO4) in 0.5 mol dm-3 H2SO4
aqueous solution. Black plus (+) and red cross (´) correspond
with the experimental and the theoretical data respectively. Frequency range
was between 4 KHz and 0.01 Hz. The inset details the shape of the semicircle at
high frequencies.
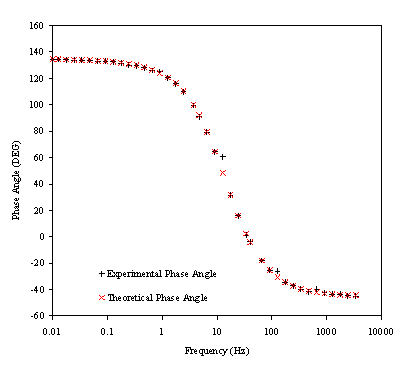
Figure 8.23. Phase component (DEG) against frequency
(Hz) for 0.1´10-3
mol dm-3 of ferricsulfate (Fe2(SO4 )3)/
0.1´10-3 mol dm-3
of ferrosulfate (FeSO4 ) in 0.5 mol dm-3 H2SO4
aqueous solution. Black plus (+) and red cross (´) correspond
with the experimental and the theoretical data respectively. Frequency range
was between 4 KHz and 0.01 Hz. Frequency axis is on a logarithmic scale.
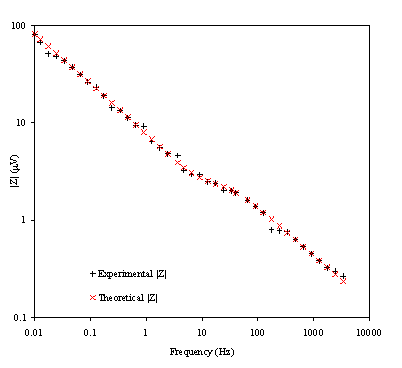
Figure 8.24. Magnitude (mV) against
frequency (Hz) for 0.1´10-3
mol dm-3 of ferricsulfate (Fe2(SO4 )3)/
0.1´10-3 mol dm-3
of ferrosulfate (FeSO4) in 0.5 mol dm-3 H2SO4
aqueous solution. Black plus (+) and red cross (´) correspond with the
experimental and the theoretical data respectively. Frequency range was between
4 KHz and 0.01 Hz. Magnitude and frequency axes are on a logarithmic scale.
Figure 8.22 shows a good agreement between the theory and the experimental data. In the first plot the general shape, magnitude and slope are equivalent for theoretical and experimental data. In the second plot there is a reasonable fit between the experimental and the theoretical data. The dispersion of the experimental data can be attributed to the fact that when high frequencies are reached the level of noise in the experimental measurements raise. This increment of noise is explained in terms of the limits of the set up. As the limits of the set up are approached the magnitude and the phase are measured with much higher levels of noise. This disturbance in the magnitude and the phase clearly affects the impedance data in the region of the high frequencies.
Figure 8.23 shows a good agreement between the experimental phase and the theoretical one. However some dispersion of the data can be observed as the high frequencies region is reached. This fact can be linked again with the limits of the experimental set up and confirm the explanation of the data dispersion in the impedance measurements at high frequencies. The dispersion of the phase at high frequencies could be explained in terms of the relaxation phenomenon. When the frequency is increased the relaxation time for the cooling process of the electrode is reduced. As higher frequencies are reached lower values for the temperature perturbation are obtained increasing the noise in the measurements.
Figure 8.24 shows a nice fit between the theoretical and the experimental data. Again as was detailed for the impedance and phase plots some dispersion data is observed at the high frequencies region. The same arguments used before can be used again to explain this.
Some extra information from the experimental data needs to be emphasised. The value of rD relates the change of the temperature when the frequency tends to one. From equation 8.57 it can be calculated that the change of temperature at the gold surface at 1 Hz is 1.4´10-2 K. This small change of temperature at the electrode perturbs the electrochemical system in controlled conditions.
There is no doubt that the technique can be improved. Looking at the equation 8.31 in detail it is apparent that the power of the heating source is increased higher frequencies can be measured. If the domain of higher frequencies is to be investigated a more powerful heating source will be required. A laser with the appropriate wavelength will be an ideal heating source to perform successfully temocps at very high frequencies.
It has to be remarked that temocps impedance is measured independently and without the use of a potentiostat. Just giving the appropriate constants in the equation 8.69 precise impedance measurements can be performed. This fact opens the possibility of studying further range of frequencies where potentiostats and frequency response analysers are limited for the disruption that their electrical components originate at very high frequencies. Using this technique less investment will be necessary to perform impedance measurements.
8.6. Conclusions
A new method of impedance measurements has been developed using relative simple equipment. This simplicity avoids the limitations of more sophisticated apparatus allowing impedance studies over wide range of frequencies.
8.7. References
1 M. Eigen, Disc. Farad. Soc., 1954, 17, 194.
2 M. J. Pilling, 'Reaction Kinetics', ed. P. W. Atkins, Oxford University Press, 1975.
3 K. J. Laidler, 'Chemical Kinetics (Third Edition)', ed. L. S. Berger, Harper Collins Publishers, 1987.
4 P. Grundler, T. Zerihun, A. Kirbs, and H. Grabow, Anal. Chim. Acta, 1995, 305, 232.
5 K. Frischmuth, P. Visocky, and P. Grundler, Internat. J. Engin. Sci., 1996, 34, 523.
6 P. Grundler, A. Kirbs, and T. Zerihun, Analyst, 1996, 121, 1805.
7 T. Zerihun and P. Grundler, J. Electroanal. Chem., 1996, 415, 85.
8 T. Zerihun and P. Grundler, J. Electroanal. Chem., 1996, 404, 243.
9 P. Grundler, Fresenius J. Anal. Chem., 1998, 362, 180.
10 P. Grundler and G. U. Flechsig, Electrochim. Acta, 1998, 43, 3451.
11 T. Zerihun and P. Grundler, J. Electroanal. Chem., 1998, 441, 57.
12 A. Beckmann, A. Schneider, and P. Grundler, Electrochem. Commun., 1999, 1, 46.
13 P. Grundler and A. Kirbs, Electroanalysis, 1999, 11, 223.
14 M. Jasinski, A. Kirbs, M. Schmehl, and P. Grundler, Electrochem. Commun., 1999, 1, 26.
15 T. Voss, P. Grundler, A. Kirbs, and G. U. Flechsig, Electrochem. Commun., 1999, 1, 383.
16 T. Voss, P. Grundler, C. M. A. Brett, and A. M. O. Brett, J. Pharmac. Biomed. Anal., 1999, 19, 127.
17 J. Wang, P. Grundler, G. U. Flechsig, M. Jasinski, J. M. Lu, J. Y. Wang, Z. Q. Zhao, and B. M. Tian, Anal. Chim. Acta, 1999, 396, 33.
18 A. Beckmann, B. A. Coles, R. G. Compton, P. Grundler, F. Marken, and A. Neudeck, J. Phys. Chem. B, 2000, 104, 764.
19 P. Grundler, Fresenius J. Anal. Chem., 2000, 367, 324.
20 A. Schneider, G. U. Flechsig, and P. Grundler, J. Electrochem. Soc., 2000, 147, 3768.
21 T. Voss, A. Kirbs, and P. Grundler, Fresenius J. Anal. Chem., 2000, 367, 320.
22 J. Wang, P. Grundler, G. U. Flechsig, M. Jasinski, G. Rivas, E. Sahlin, and J. L. L. Paz, Anal. Chem., 2000, 72, 3752.
23 J. Wang, M. Jasinski, G. U. Flechsig, P. Grundler, and B. M. Tian, Talanta, 2000, 50, 1205.
24 G. U. Flechsig, O. Korbut, and P. Grundler, Electroanalysis, 2001, 13, 786.
25 P. Grundler and D. Degenring, J. Electroanal. Chem., 2001, 512, 74.
26 P. Grundler and D. Degenring, Electroanalysis, 2001, 13, 755.
27 M. Jasinski, P. Grundler, G. U. Flechsig, and J. Wang, Electroanalysis, 2001, 13, 34.
28 O. Korbut, M. Buckova, P. Tarapcik, J. Labuda, and P. Grundler, J. Electroanal. Chem., 2001, 506, 143.
29 C. Prado, G. U. Flechsig, P. Grundler, J. S. Foord, F. Marken, and R. G. Compton, Analyst, 2002, 127, 329.
30 J. L. Valdes and B. Miller, J. Phys. Chem., 1988, 92, 4483.
31 J. L. Valdes and B. Miller, J. Phys. Chem., 1988, 92, 525.
32 J. L. Valdes and B. Miller, J. Phys. Chem., 1989, 93, 7275.
33 A. Olivier, E. Merienne, J. P. Chopart, and O. Aaboubi, Electrochim. Acta, 1992, 37, 1945.
34 C. Gabrielli and B. Tribollet, J. Electrochem. Soc., 1994, 141, 1147.
35 C. Gabrielli, M. Keddam, and J. F. Lizee, J. Electroanal. Chem., 1993, 359, 1.
36 Z. A. Rotenberg, Russ. J. Electrochem., 1998, 34, 170.
37 Z. A. Rotenberg, Electrochim. Acta, 1997, 42, 793.
38 J. F. Smalley, C. V. Krishnan, M. Goldman, S. W. Feldberg, and I. Ruzic, J. Electroanal. Chem., 1988, 248, 255.
39 D. R. Linde, in ‘CRC Handbook of Chemistry and Physics’, ed. D. R. Linde, 1994