Appendix I.
Detection and Characterisation of Charged Clusters within a Microwave Plasma
Diamond Chemical Vapour Deposition Environment
This report concerns the collaborative project between Dr In-Deok Jeon (Seoul National University, South Korea) and Dr Paul May and James Petherbridge (School of Chemistry, University of Bristol, UK), funded by Royal Society’s ‘Overseas Study Visit’ scheme (ref: KRXSI/DL), and which took place between 4th June 2001 to 31st July 2001.
1. Introduction
The growth unit of diamond in the chemical vapour deposition (CVD) environment is generally believed to be either atomic or molecular with the prime suspect being CH3 [[1]]. Sungagawa [[2]] made the suggestion that growth may be due to deposition of large clusters (hundreds to thousands) of carbon atoms. Hwang et al [[3]] suggested a charged cluster model (CCM) based on theoretical and experimental studies of diamond CVD growth. In this model the charged clusters of carbon atoms are suspended in the gas phase before becoming the diamond growth unit.
The existence of these charged clusters was experimentally confirmed in a hot filament (HF) diamond CVD reactor with a gas mixture of 1.5% CH4/H2 using a Wien filter method [[4]]. Further studies [[5]] of HF diamond CVD, using gas mixtures in the range 1-5% CH4/H2, showed that cluster size increases with increased input methane concentration (as illustrated in Figure 1).
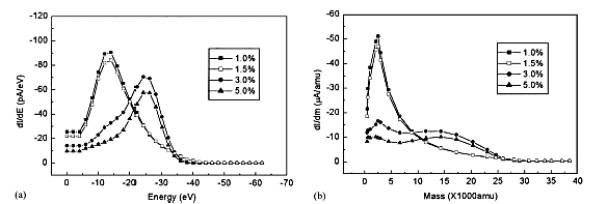
Figure 1. (a) Energy and (b)
mass distributions of negatively charged carbon clusters extracted from a HF
reactor using gas mixtures of 1, 1.5, 3 and 5% CH4/H2 (From
Reference 5).
These results were obtained using a retarding field
detector (as shown in Figure 2) in which a three-chamber system with two-stage differential
pumping was used to sample gas from the CVD chamber. With this system, reaction chamber pressure was 6 Torr while the
measuring chamber was maintained at less than 10-5 Torr. The gas
adjacent to the substrate for diamond deposition in the HF reactor was
extracted through a sampling orifice (1.2 mm diameter) to the second chamber
and then through a skimmer (2.0 mm diameter) to the measuring chamber. The distance between the filament and the
orifice was 5 mm. The current variation was measured on the detector with
concurrent scanning of the repelling voltage.
Figure 2. Diagram of gas sampling system and charged
cluster detector used to obtain data in Figure 1 (adapted from Reference 5).
2. Aims
The aims of the current project can be summarised as below:
- Coupling of existing microwave plasma sampling apparatus to charged cluster detector (CCD), as outlined above.
- Detection of charged clusters in 1-4% CH4/H2 microwave plasmas.
- Determination of charged cluster sizes.
- Expansion of study to include a range of other gas mixtures.
3. Experimental
3.1. Overview.
The existing gas sampling apparatus, consisting of a two stage differential pumping system, was modified for this study. This system consisted of a molybdenum probe which impinged on the visible boundary of the MW plasma (~25 mm from plasma centre. Gas passed through an orifice (100 mm) in the probe into the first pumped stage (maintained at ~ 10-3 Torr), experienced a large pressure drop, and then formed a molecular beam in which all components should have the same velocity. This first stage was pumped by a backed turbomolecular pump (240 l s-1).
The existing system then contained a quadrapole mass spectrometer which formed the second stage (~ 10-6 Torr). A new chamber, separated from the first stage by a skimmer mounted on a flange, replaced this. The new second stage was pumped by a backed turbomolecular pump (70 l s-1) and had two ports, one an electrical feed-through, and another a pirani pressure gauge mount. The configuration of the flange and skimmer were both modified but the overall layout of the system was relatively unchanged, with only the separation (if any) between the two stages being varied (see Figure 3).
Figure
3. Diagram of apparatus for all charged
cluster studies showing reactor chamber, pressure controllers, plasma sampling
and detector housing (further details in section 3.3).
3.2. Electrical configurations of detectors
Two types of simple detector set-ups were utilised in the attempt to detect the presence of (any) charged particles within the plasma. Firstly, two simplified versions of the detector shown in Figure 2 were used. Both consisted of a detector plate and two grids, all three electrically isolated from each other allowing each to be biased independently. The first detector used a rough grid of steel wire and also proved too bulky for the majority of experiments carried out. A second detector was therefore constructed with an aluminium plate and copper grids (1 mm mesh) supported by aluminium rings (as illustrated in Figure 4). Initially the front plate was grounded and the bias on the plate was varied, leaving the middle grid floating. Secondly a biased probe was inserted into the sample probe in order to follow the progress of charged particles through the probe. Both configurations are outlined in figure 5.
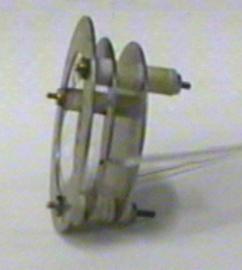
Figure
4. Photograph of modified plate
detector showing grids supported by aluminium rings and the aluminium detector
plate. Electrical connections to the
middle grid and back plate are also clear.
Figure
5. Detector configurations for
detection of charged particles produced by microwave plasma.
With the presence of charged particles confirmed the detector was modified to two repelling field configurations as shown in Figure 6.
Figure
6. Retarding field detector
configuration.
In this detector configuration shown in Figure 6(a) the sampled gas first passes through a grounded mesh, then another mesh, before hitting the detector plate. The bias of the second mesh is scanned causing a retarding field to form between this and the grounded mesh. The detector is kept at a constant bias and the current flowing between plate and ground is monitored with changing grid bias. Figure 6(b) illustrates a detector configuration in which both the grids in front of the detector plate were grounded and a variable bias was applied to the detector plate with the current flowing to ground from the plate being monitored.
For all three of the detector arrangements discussed above, the variable voltage was applied by and the current was measured by an electrometer (Keithley model 617) controlled and data logged by a PC running the Testpoint software package. Experiments carried out where a fixed voltage was applied to the detector plate required the use of a regulated DC power supply (Maplin model XM22).
3.3. Placement of detectors
All experiments were carried out with a reaction chamber pressure of 20 Torr (when not evacuated) and applied microwave power (when plasma was on) of 1000 W.
3.3.1.
Mark I Apparatus
This work involved many difficulties not originally envisaged at the outset of the project. Firstly the charged cluster detector apparatus was coupled to the 2 stage gas sampling system in such a manner that the detector was ~ 30 cm distance from the orifice where gas was sampled (from the very edge of the plasma ball), as shown in Figure 7.
Figure 7. Mark I apparatus set-up. Typical pumping
stage pressures are shown for sampling of gas from a plasma at a pressure of 20
Torr. The skimmer and sample probe
orifice sizes are also shown.
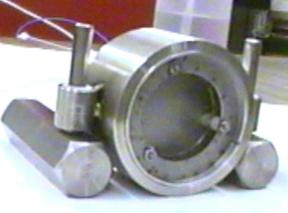
A picture of the detector in place within the 2nd pumping stage is presented below.
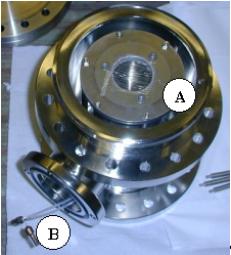
Figure 8. Picture of 2nd pumping stage
housing showing (A) front of detector and (B) electrical feed through port.
Although a signal was obtained using this set-up it was found to be due to H2+ ions produced by the second stage penning pressure gauge. With the gauge switched off no difference in signal was seen between H2 (20 Torr, no plasma) and a H2 plasma (20 Torr, 1000 W). It was concluded that any charged particles (i.e. electrons molecular ions or clusters) extracted from the plasma ball had failed to travel the 30 cm from sample cone orifice, through the skimmer and into the detector.
3.3.2.
Mark II Apparatus
The apparatus was then modified to allow placing of the skimmer and a modified detector (see Figure 4) closer to the orifice. It was also possible to detect any charged particles reaching the skimmer cone but not passing through to the detector, as the cone was electrically isolated from the rest of the apparatus (as shown in Figure 9).
![]()
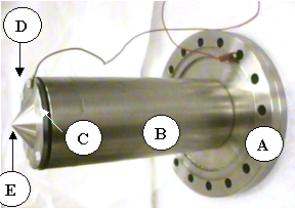
Figure
9. Modification to skimmer and detector
housing (second pumping stage) showing (A) 6 inch flange mounting (B) 150 mm
extended casing (C) Viton gasket (D) plastic screw with washer and electrical
connection and (E) electrically isolated skimmer cone. A smaller detector was used than for Mark I
apparatus and was mounted directly behind the skimmer cone.
Figure 10. Mark II apparatus set-up. Typical pumping stage pressures are shown
for sampling of gas from a plasma at a pressure of 20 Torr.
As no significant difference between signal for 100% H2 and 4% CH4/H2 was detected either by the detector or the skimmer cone, it was concluded that large charged carbon clusters may have not traveled further than the sampling probe (i.e. they may have hit the inner walls of the probe). Another possibility was that no charged particles of any kind were passing through the orifice in the (grounded) sample probe. In order to check this, a tungsten rod (~ 1 mm diameter) was inserted into the sampling probe and placed ~ 1 mm from the orifice (as shown below). This rod was secured in place by a ceramic plug inserted into the sample probe.
3.3.3.
Mark III Apparatus
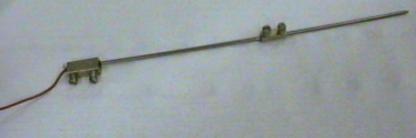
Figure
11. Tungsten rod.
Figure 12. Mark III apparatus set-up. Typical pumping stage pressures are shown
for sampling of gas from a plasma at a pressure of 20 Torr.
The current flowing to earth from the probe was monitored with and without a plasma present, in a H2 atmosphere. An increase in this current was seen when the plasma was struck, indicating that charged particles were indeed passing through the orifice in the sample probe. The probe was moved back 50 mm and a (smaller) signal was still detected, indicating that these charged particles were reaching the back of the sample probe.
3.3.4.
Mark IV Apparatus
In light of the previous result it was decided to remove the skimmer and combine the two pumping stages together. The detector could then be placed directly behind the sample cone and providing the pressure in the detector was kept < 10-4 Torr data could be collected. The experimental set-up is outlined below.
Figure 13. Mark IV apparatus set-up. Typical pumping stage pressure is shown for
sampling of gas from a plasma at a pressure of 20 Torr.
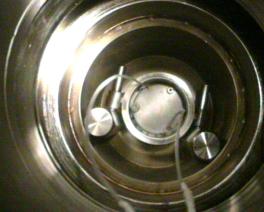
Pictures of the detector and holder are presented below.
(a) (b)
Figure
14. Pictures of charged cluster
detector (a) in holder and (b) in holder placed in position behind sample cone.
4. Results
The results obtained using all of the experimental configurations discussed above will now be presented and examined in turn.
4.1. Mark I
The bias on the detector plate was swept from 100 to –100 V with: 20 Torr H2 (plasma on and off) and also 4% CH4/H2 plasma present in the reaction chamber. As Figure 14 shows, all three gave very similar I-V characteristics although it was found that the signal disappeared when the 2nd stage Pirani pressure gauge was switched off. This indicated that although the detector could detect negative particles produced by the gauge it was situated too far away from the sample probe to detect signal due to charged particles originating in the plasma.
It is also clear from Figure 15 that the gauge-on signal is larger for H2 when a plasma is not present. This is due to the fact that the pressure in the detector is higher in the absence of a hot plasma in the microwave chamber. This is because less molecules are required (for a constant gas volume) to maintain a chamber pressure of 20 Torr when a hot plasma is present, i.e.
PV = nRT Equation 1
Þ if P and V are constant:
n µ 1/T ` Equation 2
This means that more molecules pass into the detector when the chamber temperature is lower (i.e. no plasma present). This results in a higher pressure and therefore a higher signal.
Figure
15. I-V results for Mark I type
detector set-up.
4.2. Mark II
Again the plate voltage was swept from 100 to –100 V with H2 and 5% CH4/H2 gas mixtures present in the microwave chamber (20 Torr, 1000 W). Readings for H2 with no plasma were also carried out. Measurements were also obtained by biasing the skimmer cone placed in front of the detector. As can be seen from Figure 15 all gas mixtures (with and without plasma present) give very similar results. The curving of data points between ~100 and 80 V is probably a switch-on effect (data are taken from 100 to –100 V).
Applying a variable voltage to the skimmer cone also gave a negative result. As is seen in Figure 16, both 100% H2 and 4% CH4/H2 plasmas gave identical results. Combined with the results provided by the detector it was decided that no charged particles were reaching either the skimmer cone or the detector.
Figure 16. Results for Mark II detector set-up.
Figure 17. Results for Mark II set-up (Skimmer cone).
4.3. Mark III
Results are presented from a biased rod placed within the sample probe, at distances of 1 and 50 mm from the orifice. Figure 17 shows that there is a significant difference between the I-V curve obtained for H2 with and without a plasma present. This is true for both probe positions. Also addition of 1% CH4 to the H2 plasmas increases the signal for both probe positions although it should be noted that reduction in signal is observed for the 50 mm probe-orifice separation.
Figure
18. I-V curves obtained using Mark III,
biased rod apparatus. Data were
obtained with the rod tip positioned 1 and 50 mm from the orifice in the sample
probe.
It was therefore concluded that charged particles could be detected at a position behind the sample probe (50 mm from orifice) and that the detector could be moved into a position close to this.
4.4 Mark IV
Initial results were obtained using a biased plate detector configuration (see Figure 5(a)) before two repelling field set-ups were tried, as shown in Figure 6.
4.4.1.
Plate detector
Figure shows that there is a considerable change in the I-V characteristics of the detector when a plasma is struck in H2 (20 Torr, 1000 W). However no significant contrast is observed between results obtained from 100% H2 and 1, 2 and 3% CH4/H2 microwave plasmas. These observations suggest that although charged particles were produced within, and extracted from, the plasma, there appears to be no significant difference in the type of particles detected when adding CH4 to the H2 plasma.
Figure
19. I-V curves obtained using Mark IV
biased plate apparatus. Data were
obtained with the detector positioned 100 mm from the orifice in the sample
probe.
4.4.2.
Retarding field detector I
The detector configuration was changed to allow the plate to be biased at a fixed voltage (±11 V) while the bias applied to the second (non grounded) grid was varied (60 to –60 V). Measurements of the current flowing to earth from the plate were made of both 100% H2 and 3% CH4/H2 microwave plasmas. As Figure 19 shows, although changing the voltage applied to the detector plate significantly affects the result obtained for a fixed voltage, little difference is seen between the results obtained from 100% H2 and 3% CH4/H2 plasmas. The noise evident in the plot is a result of insufficient smoothing of the output of the fixed voltage power supply.
 Figure
20. I-V curves obtained using retarding
field detector I (Mark IV detector placement).
Figure
20. I-V curves obtained using retarding
field detector I (Mark IV detector placement).
4.4.3. Retarding field detector II
This configuration consisted of two grounded grids in front of the detector plate which was had a variable bias (40 to –40 V) applied to it. The current flowing from the plate to ground was measured with H2 (plasma and no plasma) and 3% CH4/H2 (plasma) present in the reaction chamber. As figure 20 shows, similar behaviour is seen as for the biased plate experiment although the ripples previously seen at ~20 V (see Figure 18) are absent in this case. Again little change in behaviour is seen between 100% H2 and 3% CH4/H2 plasmas.
 Figure
21. I-V curves obtained using retarding field detector II (Mark IV detector
placement).
Figure
21. I-V curves obtained using retarding field detector II (Mark IV detector
placement).
Differentiating the I-V curves shown above produces the plot shown below. Here two peaks can clearly be seen at –2 and 0 V. The kinetic energy of electrons and ions in a typical CVD microwave plasma is of the order of 0-10 and 0.07-0.4 eV, respectively[[6]], therefore it is reasonable to attribute these peaks to electrons (2 eV) and ions (~0 eV at this experimental resolution). As these peaks are identical for both 100% H2 and 3% CH4/H2 plasmas it is reasonable to propose that the ions being detected are probably H+, H2+ or H3+.
Figure 22. Differential dI-dV curves obtained using
retarding field detector II (Mark IV detector placement). This is a differentiated version of Figure
21.
5. Conclusions
In conclusion, no convincing evidence for the existence of negatively charged clusters within a CH4/H2 microwave plasma has been found. This suggests that the presence of a hot filament is necessary for the production and therefore detection of such clusters (as detected in references 4 and 5). The origin of such clusters is therefore likely to be debris flaking off of the carburised filament. However, we have been able to successfully measure the kinetic energy of electrons and positive ions within the microwave plasma, with values of 2 eV and ~0 eV respectively.