Chapter 4 - Results for C/H Systems
4.1
Introduction
As
demonstrated in the previous chapter, the technique of molecular beam mass
spectrometry is able to provide quantitative measurements of both stable and
free radical gas-phase species under conditions typical in the diamond CVD
process. Due care has to be taken,
however, in the data reduction procedures because the overall system
sensitivity is critically dependent on the local temperature, pressure and
composition of the gas being sampled.
Such variations in the sampling efficiency can be offset by performing
simple empirically-based correction procedures. Equipped with a sensitive gas-phase analysis technique and the
necessary data reduction procedures for the characterization of a CVD
environment, gas phase composition measurements were performed for a variety of
source gas mixtures. Extensive work has
already been done on the effects that different hydrocarbon precursors (See
Table 3.2) have on the CVD diamond growth mechanism by comparing the variation
in the composition of the stable gas phase species and CH3 radicals
as a function of filament temperature.3.1,3.2,3.14 These results are not discussed in detail in
this chapter, though the overall conclusions drawn for these hydrocarbon/H2
systems have been included, in order to enable the reader to identify and
understand the changes that occur when other gas phase systems are used, such
as C/H/Cl, C/H/N and C/H/P systems (which will be discussed fully in their
respective chapters).
4.2 Cracking
patterns of CH4

Figure
4.1 shows how the signal intensities of methane and its dissociation products
vary as a function of electron energy in the ionization chamber of the mass
spectrometer. By the same linear interpolation method described in Section 3.5
(a), the measured ionization potential (I.P.) for CH4 and the
appearance potentials (A.P.’s) for the different species observed (CH3,
CH2 and CH) were obtained and compared with literature values (Table
4.1).
|
Species |
Measured I.P. (eV) |
Literature Value (eV)3.21 |
Measured A.P. (eV) |
Literature Value (eV)3.21 |
|
CH4 (m/e=16) |
12.4 ± 0.2 |
12.80 |
- |
- |
|
CH3 (m/e=15) |
- |
9.96 |
13.9 ± 0.3 |
14.3 |
|
CH2 (m/e=14) |
- |
- |
17.6 ± 2.4 |
16.5 |
|
CH (m/e=13) |
- |
- |
23.8 ± 1.5 |
23.4 |
Table 4.1. I.P.’s and A.P.’s of methane and its observed dissociation
fragments.
The
A.P.’s of the species observed after electron bombardment of methane relate to
the energy required for the following processes:3.21
A.P. (CH3): CH4 ® CH3+
+ H + e-
A.P. (CH2): CH4 ® CH2+
+ H2 + e-
A.P. (CH): CH4 ® CH+ + H + H + H
+ e-
Inspection
of Figure 4.1 shows that dissociative ionisation of CH4 produces
mainly methyl ions, with only small amounts of CH2+ and
CH+ ions are formed. This
may be related to the number of C-H bonds that need to be broken.
4.3 Cracking
patterns of C2H2
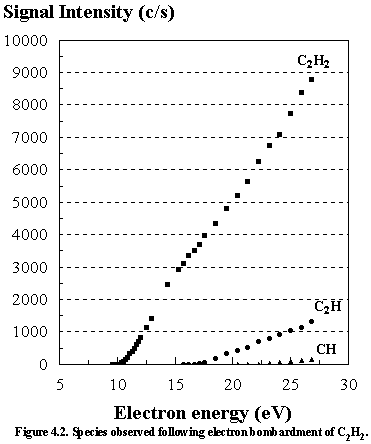
Figure 4.2 shows how the signal intensity of acetylene and its dissociation products vary as a function of electron energy in the ionization chamber of the mass spectrometer. The I.P. of acetylene and A.P.’s of the dissociation products are summarized in Table 4.2, and compared with the literature values.
|
Species |
Measured I.P. (eV) |
Literature Value (eV)3.21 |
Measured A.P. (eV) |
Literature Value (eV)3.21 |
|
C2H2 (m/e=26) |
11.1 ± 0.5 |
11.41 |
- |
- |
|
C2H (m/e=25) |
- |
- |
17.9 ± 0.5 |
17.8 ± 0.5 |
|
CH (m/e=13) |
- |
- |
22.6 ± 0.4 |
22.3 ± 0.5 |
Table 4.2. I.P.’s and A.P.’s of acetylene and its
observed dissociation fragments.
Inspection
of Figure 4.2 reveals that acetylene contributes by far the greatest
signal. Only trace amounts of the C2H
and CH species were observed at high electron energies (above 22 eV).
The
A.P.’s of C2H and CH arise from the following processes:3.21
A.P. (C2H): C2H2 ® C2H+
+ H + e-
A.P. (CH): C2H2 ® CH+ + C + H + e-
(or CH+ + CH + e-, neither was given)
4.4 Gas
phase composition as a function of filament temperature for 1% CH4
in H2
Figure
4.3 shows how the concentration of the major hydrocarbon species [CH4
(m/e =16), C2H4
(m/e =26) and C2H2
(m/e =28)] as well as CH3
radicals change as a function of filament temperature measured 4 mm from
the filament for an initial CH4/H2 feedstock ratio of
1%. Note that the total carbon balance,
defined as (total C fraction measured)/(C fraction in the feed gas), and shown
as an upside down triangle in Figure 4.3, decreases as
the filament temperature increases, because of the thermal diffusion effects
described in Section 3.5 (e).
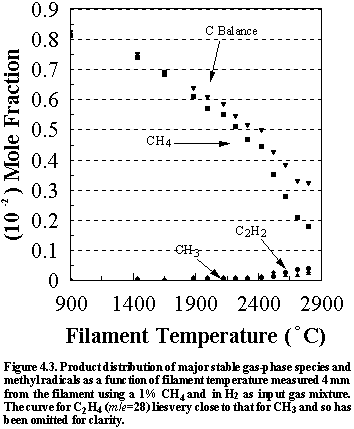
The main chemical conversion occurring in the chamber is that of methane to acetylene as the filament temperature is increased, a reaction that is initiated by the reaction of H atoms with methane to produce methyl radicals:
CH4 +
H ![]() CH3 + H2 (4.1)
CH3 + H2 (4.1)
Methyl recombination followed by successive H
abstraction yields acetylene. As the filament temperature increases, the
increasing H atom concentration drives the equilibrium from CH4,
through C2H6 and C2H4 to C2H2. Due to its transient nature (and thus very
low steady-state concentration) under conditions rich in H atoms, no C2H6
was detected in the gas phase.
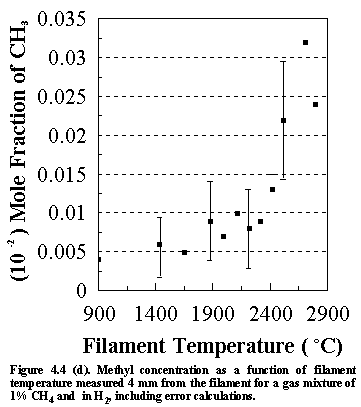
Quantitative measurements of the absolute concentrations of methyl
radicals were made simultaneously and are displayed in Figures 4.3. An increase in the filament temperature
results in higher [CH3] which is mirrored by increased [C2H2]. Therefore the CH3 radical is an
essential intermediate in the formation of acetylene.
4.5
Discussion of errors
Shown
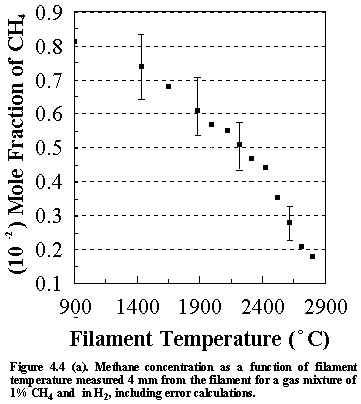
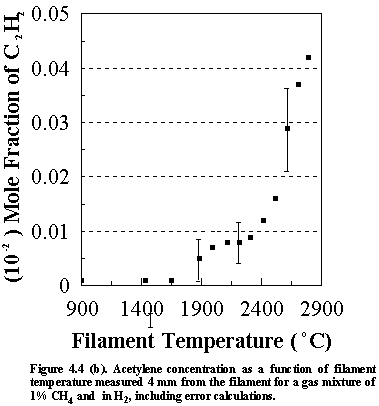
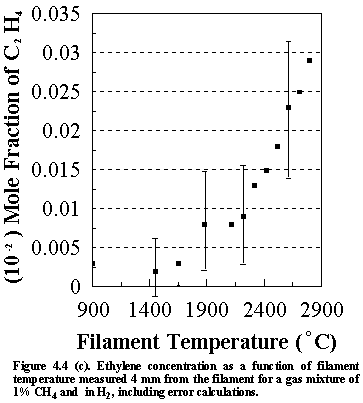
in Figure 4.4 are the errors that are inherent in the calculated species
concentrations for the various stable hydrocarbon species (and CH3
radicals) monitored. These values were
obtained using standard combination of errors techniques, in which the error in
the derived parameter (in this case the species concentrations) is determined
from the measured parameters (i.e. the MBMS signal intensities of each of the
measured species). Calculations for
both stable and free radical species were semi-automated using a spreadsheet
program (ASEASYAS). Similar
calculations were performed for all the other gas phase systems, including
C/H/Cl, C/H/N and C/H/P systems.
However, since the gas phase species lie very close to each other on the
graphs, their concentrations are presented with no error bars for clarity. The errors shown in Figures 4(a)-(d) are
representative of the magnitude observed for all subsequent MBMS experimental
runs.
It is worth considering the sources of other uncertainties when interpreting the MBMS data. The factors affecting the error that are inherent in the calculated species mole fractions not only include (1) the sensitivity of the MS and (2) the signal/noise ratio, but also (3) changes in the kinetic energy of the electron bombardment (which will relate to the age of the cathode filaments) and (4) filament/sampling cone distances. These factors will inevitably influence the uncertainties in the run to run reproducibility of the MS system, and hence the accuracy of the measured species mole fractions.
There
are also errors that may be inherent in the measured values of the filament
temperature. Such errors will arise
from uncertainty in the positioning of the pyrometer and the emissivity of the
filament, which reflects on the age of and history of the filament. In the latter case, for example, the
emissivity of the tantalum filament may be different to that of tantalum
carbide which is formed when the filament is carburised by CH4. Throughout the MBMS experiments conducted in
this work the tantalum filament had been previously ‘seasoned’ or carburised
with the source gas mixture later being examined.
4.6 Gas
composition as a function of filament temperature for a variety of hydrocarbon
precursor gases
Similar
measurements of the stable gas species were made using different hydrocarbon
precursor gases.3.1,3.2 It
has been established that regardless of the hydrocarbon precursor gas used, at
filament temperatures between 2000 and 2100°C the subsequent chemistry
is such that methane becomes the dominant hydrocarbon species. Furthermore, at filament temperatures near
to, and above, the optimum for diamond growth (ca. 2400°C) the relative
concentrations of the various stable hydrocarbon species present in the gas
mixture, and the way the concentrations vary with temperature, are both
remarkably insensitive to the choice of hydrocarbon feedstock gas.
4.7 Analysis
of the films grown using 0.5% and 1% CH4 in H2
Figure
4.5 shows scanning electron micrographs (top view and cross-section) of a
polycrystalline diamond film grown on silicon (100) using 0.5% CH4
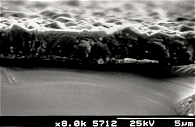
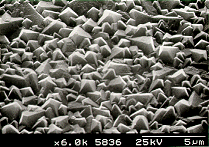
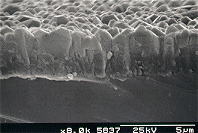
in H2 under standard deposition conditions (See Section 3.1). Figure 4.6 shows a similar film grown using
1% CH4 in H2 gas mixture. The growth rates (Table 4.3) were calculated from the film
thickness, determined from cross-sectional SEM images, divided by the time of
growth (6 hours). These deposition
experiments were carried to allow the comparison between films grown using
standard methane/H2 gas mixtures with those grown using other gas
phase systems, such as C/H/Cl, C/H/N and C/H/P systems, following claims that
addition of small quantities of these elements has noticeable effects on the
growth rate, the morphology and the resulting quality of the diamond films. Full discussion of each of these gas phase
systems are given in their respective chapters (5-7).
|
|
Figure 4.5(a). Scanning electron
micrograph (SEM) of a polycrystalline diamond film grown on silicon using input
gas mixtures of 0.5% CH4 in hydrogen. |
Figure 4.5(b). Scanning electron
micrograph showing the cross sectional view of the film. |
|
|
Figure 4.6(a). Scanning electron
micrograph (SEM) of a polycrystalline diamond film grown on silicon using input
gas mixtures of 1% CH4 in hydrogen. |
Figure 4.6(b). Scanning electron
micrograph showing the cross sectional view of the film. |
|
Gas Mixture |
Film Thickness (mm) after 6 hours growth |
Deposition Rate (mm/hr) |
|
0.5% CH4
in H2 |
1.9 |
0.32 |
|
1% CH4
in H2 |
2.4 |
0.40 |
Table 4.3. Diamond film thickness and deposition rate for 0.5% and 1% CH4
in H2 gas mixtures.
4.8
Appendix: Experimental Data
The
following tables show actual experimental data recorded for 1% CH4
in H2. Table 4.4 shows the
signal intensities measured for the stable hydrocarbon species as well as CH3
radicals as a function of filament temperature. Table 4.5 shows signal intensities of the stable species after
background subtraction and MS sampling efficiency corrections. The mole fractions of these species were then
determined by direct room temperature calibration, and are shown in Table
4.6. Methyl radical concentrations were
also determined using a slightly different procedure (See Section 3.6 (b) ). Error calculations using ASEASYAS are
displayed in the tables for five selected temperature readings.
1%
CH4 in H2 at 20 Torr vs. Filament Temperature
MS Probe Parameters: -6% (DISCRIM), -20% (DELTAM), -40% (RES’N), 2550V (SEM), 3.0V (CAGE) 140mA (EMISS).
MS Pressure =
8x10⁻⁷ Torr
Table 4.4. Signal Intensity vs. Filament Temperature
|
Fil. Temp (°C) |
CH4 (15.6eV) |
C2H2 (15.6eV) |
C2H4 (13.6eV) |
CH3 (13.6eV) |
H2 (15.6eV) |
|
23 |
1470 ± 32 |
8 ±
2 |
3 ±
1 |
0 ±
0 |
141000 ±
3000 |
|
800 |
1008 |
5 |
4 |
6 |
119000 |
|
1400 |
832 |
6 |
3 |
6 |
108000 |
|
1600 |
707 ±
17 |
6 ±
1 |
3 ±
1 |
5 ±
1 |
100000 ±
4000 |
|
1810 |
602 |
14 |
7 |
6 |
95000 |
|
1910 |
549 ±
16 |
18 ±
3 |
10 ±
2 |
5 ±
1 |
93000 ±
4000 |
|
2030 |
520 |
19 |
7 |
6 |
91000 |
|
2120 |
465 |
20 |
7 |
5 |
88000 |
|
2210 |
423 ±
15 |
21 ±
4 |
10 ±
2 |
5 ±
1 |
87000 ±
3000 |
|
2310 |
381 |
26 |
11 |
6 |
83000 |
|
2400 |
305 |
34 |
13 |
9 |
83000 |
|
2490 |
230 ±
9 |
55 ±
5 |
15 ±
2 |
8 ±
1 |
79000 ±
4000 |
|
2575 |
168 |
67 |
15 |
11 |
77000 |
|
2655 |
140 |
73 |
18 |
8 |
74000 |
|
Background Signal |
4 ±
1 |
3 ±
1 |
1 ±
1 |
0 ±
0 |
3560 ± 500 |
Table 4.5. Signal Intensity vs.
Filament Temperature after background subtraction and MS efficiency corrections
|
Fil. Temp (°C) |
CH4 (15.6eV) |
C2H2 (15.6eV) |
C2H4 (13.6eV) |
CH3 (13.6eV) |
|
23 |
1466 ± 108 |
5.0 ± 3 |
2.0 ± 2 |
0.0 ± 0 |
|
800 |
1195 |
2.3 |
3.6 |
2.2 |
|
1400 |
1090 |
3.9 |
2.6 |
3.4 |
|
1600 |
1002 ±
98 |
4.3 ± 4 |
2.9 ± 3 |
3.0 ± 2 |
|
1810 |
899 |
16.5 |
9.0 |
5.3 |
|
1910 |
837 ± 90 |
23.1 ± 8 |
13.8 ±
5 |
4.2 ± 2 |
|
2030 |
811 |
25.1 |
9.4 |
6.1 |
|
2120 |
750 |
27.7 |
9.8 |
5.0 |
|
2210 |
690 ± 73 |
29.6 ± 10 |
14.8 ±
5 |
5.4 ± 2 |
|
2310 |
652 |
39.8 |
17.3 |
7.7 |
|
2400 |
521 |
53.6 |
20.8 |
13.4 |
|
2490 |
412 ± 54 |
94.7 ± 19 |
25.5 ±
7 |
12.9 ±
3 |
|
2575 |
307 |
119.8 |
26.2 |
19.3 |
|
2655 |
265 |
136.6 |
33.2 |
14.5 |
Room temperature calibration
of stable species
1% CH4
in H2 at 20 Torr =
1466 c/s ± 33 (15.6eV)
1% C2H2
in H2 at 20 Torr = 3260
c/s ± 44 (15.6eV)
1% C2H4
in H2 at 20 Torr = 1131
c/s ± 30 (13.6eV)
1% CH3
in H2 at 20 Torr = 606 c/s ± 39 (13.6eV)*
Table 4.6. Species Mole Fractions vs.
Filament Temperature
|
Fil. Temp (°C) |
CH4 (15.6eV) |
C2H2 (15.6eV) |
C2H4 (13.6eV) |
CH3 (13.6eV) |
|
23 |
1.000 ±
0.098 |
0.002 ±
0.001 |
0.002 ±
0.002 |
0.000 ±
0.001 |
|
800 |
0.813 |
0.001 |
0.003 |
0.004 |
|
1400 |
0.741 |
0.001 |
0.002 |
0.006 |
|
1600 |
0.682 ±
0.083 |
0.001 ±
0.001 |
0.003 ±
0.003 |
0.005 ±
0.003 |
|
1810 |
0.611 |
0.005 |
0.008 |
0.009 |
|
1910 |
0.570 ±
0.075 |
0.007 ±
0.003 |
0.012 ±
0.005 |
0.007 ±
0.004 |
|
2030 |
0.552 |
0.008 |
0.008 |
0.010 |
|
2120 |
0.510 |
0.008 |
0.009 |
0.008 |
|
2210 |
0.469 ±
0.061 |
0.009 ±
0.003 |
0.013 ±
0.005 |
0.009 ±
0.004 |
|
2310 |
0.444 |
0.012 |
0.015 |
0.013 |
|
2400 |
0.354 |
0.016 |
0.018 |
0.022 |
|
2490 |
0.280 ±
0.043 |
0.029 ±
0.006 |
0.023 ±
0.007 |
0.021 ±
0.006 |
|
2575 |
0.209 |
0.037 |
0.023 |
0.032 |
|
2655 |
0.181 |
0.042 |
0.029 |
0.024 |
* The error for 1% CH3 signal may
be larger than the value quoted here since there will be errors arising from
the determination of the beam component of the sampled gas (~0.35 of the total
signal). See Section 3.5 (i) for details of the measurements.

