Chapter 6 - Results for C/H/N Systems
6.1 Introduction
The
incorporation of unwanted impurities invariably present in reactant gases
remains one of the main drawbacks in CVD diamond growth. The most commonly occurring impurity in both
natural and synthetic diamond is nitrogen.
Inclusion of small amounts of this element has a noticeable effect on
the growth of CVD diamond films and on many of the physical properties of the
material,6.1-6.5 namely its optical transparency and thermal and
electrical conductivity. The presence
of nitrogen in the reactant gases can also seriously alter the morphology of
deposited diamond films which restricts their usefulness for some applications,
especially those that require high quality electronic grade diamond.5.12 Alternatively, however, nitrogen-doped CVD
diamond and diamond-like carbon (DLC) films may have very useful semiconducting
properties, which are particularly important for microelectronics and field
emission display applications.6.6-6.10 These discoveries have attracted widespread research interest,
and prompted many groups to investigate the effects of nitrogen on the growth
of CVD diamond films using CH4/H2 gas mixtures.6.1-6.5,6.11-6.16 Hong et
al.6.17,6.18 also studied the influence of adding nitrogen gas
to a more unconventional CH4/CO2 gas mixture.
Recent
studies have shown that addition of nitrogen to the input gas mixtures causes
significant changes in the morphology, the quality and the growth rate of
diamond films. For example, Bohr et al.6.12 found that the
growth habit and deposition rate using CH4/N2/H2
mixtures in a hot filament CVD system depended strongly on the ratio of
carbon-to-nitrogen in the feed gas; in the region of the [N]/[C] ratio relevant
to the present work they observe that small N2 additions (up to 20%
N2/CH4) not only increased the growth rate by a factor of
~2, but improved the diamond phase purity, as revealed by laser Raman
spectroscopy. Higher N2
additions (20% to 40% N2/CH4) resulted in deterioration
of the quality of the diamond films, a reversal of growth rates, and a change
in the surface morphology from (111) to predominantly (100) facets. In a somewhat related study, Badzian et al.6.15 grew diamond using
a CH4/N2 mixture both in the absence of H2,
and with added H2. They
observed a considerable amount of distortion in the crystal structure of the
grown diamond films with N doping, and a reduction in the growth rate with
nitrogen addition in the input gas mixture.
To date, the precise reaction mechanisms attributable to these
observations have not been studied in detail.
Although various mechanisms have been proposed involving gas-phase
and/or gas-solid reactions,6.12,6.15,6.17 it is difficult to draw
any parallels between them since very different source gas mixtures were being
used. In many cases however, the amount
of nitrogen incorporated into the diamond films was found to be very low,6.1,6.15,6.17
regardless of the choice of precursors used, which suggests that the growth
mechanism is likely to be dominated by gas-phase chemistry rather than gas-solid
heterogeneous reactions. In this
article we report on the behaviour of nitrogen in hot filament assisted CVD of
diamond in terms of the changes in the gas-phase chemistry when nitrogen is
present, using various C/N-containing source gases. In-situ molecular beam
mass spectrometry3.1,5.21,5.22 was used to characterise the gas
phase environment, and to determine the mole fractions of the stable gas-phase
species prevalent during the CVD process. Such information provides valuable
understanding of the reaction mechanisms involved when nitrogen is added to the
gas mixtures.
6.2 Experimental Details
(a) Deposition experiments
Table 6.1
below shows the growth conditions used for the C/H/N system. For full experimental details on deposition
techniques please refer to Chapter 3 (Sections 3.1 and 3.2).
Pressure 20
Torr
Gases (1)
0.5% CH4/0.5% NH3; (2) 0.5% CH3NH2;(3)
0.5% HCN and (4) 0.5% CH4/0.25% N2.
Total gas flow rate 200
sccm
Substrate type Si
(100) substrates (manually abraded)
Substrate temperature ~
900°C
Filament temperature 2300-2400°C (filament current 6½-6¾ A)
Filament/substrate distance 4 mm
Deposition time 6
hours
Table 6.1. Deposition conditions used for C/H/N system.
For these conditions, and
using a gas mixture of 0.5% CH4 in H2, typical growth
rates of microcrystalline CVD diamond were ~0.32 mm h-1 (See Section 4.6). In the present study, methane was replaced
with a variety of C- and/or N-containing precursor gases, always ensuring a
constant C:N ratio of 1:1. The C/N
source gases were introduced into the reaction chamber in three different
forms: (1) the C and N present in separate small molecules, such as CH4
+ NH3 (or N2); (2) the C and N bonded together in the
same molecule, as in methylamine (CH3NH2); and (3) the C
and N present as CºN in hydrogen cyanide gas
(HCN). All the precursors were obtained
as commercial products except for HCN, which was synthesised by the reaction of
NaCN with phosphoric acid (dried by addition of P2O5) in vacuo (See Appendix I).
(b) Film analysis
The
as-grown films were investigated by scanning electron microscope (SEM) and
Auger electron spectroscopy (AES).
Laser Raman Spectroscopy (LRS) and secondary ion mass spectroscopy
(SIMS) was also carried out on the films produced by CH4/N2/H2
gas mixtures. The composition of films
produced by the other C/N precursor gases have been determined using other
spectroscopic techniques, such as Transmission Electron Microscopy (TEM) and
X-ray diffraction (XRD) and is reported elsewhere.6.19
(c) Gas-phase composition measurements
Gas-phase
product distributions were monitored as a function of the filament temperature
for all C/N precursor gases. The
ionization potentials of all the C-, N- and N/C- containing species that were
monitored, together with the electron energy at which they were measured, are
shown Appendix II.
When measuring the signal
for N2 species (m/e = 28,
I.P. = 15.55 eV) using an electron energy of 30 eV, corrections were
made to eliminate signal interference from C2H4 (IP =
10.51 eV) and CO (IP = 14.0 eV).
Similar corrections were also performed for other species, such as the
CH4 signal (m/e = 16) due
to the dissociative ionization of NH3 to NH2 (m/e = 16); and the NH3 signal
(m/e = 17) due to fragmentation of
methylamine (CH3NH2).
For full details on the correction procedures, see Section 3.6.
6.3 Analysis of the diamond
films
|
C/N
Precursor Gas
|
Growth
Rate/ mm h-1
|
%
CH4
Mole
Fraction
|
%
NH3
Mole
Fraction
|
%
C2H2
Mole
Fraction
|
%
HCN
Mole
Fraction
|
%
CH3NH2
Mole
Fraction
|
|
0.5% CH4/ 0.5% NH3
|
< 0.07
|
0.017
|
0.041
|
0.002
|
0.102
|
0.000
|
|
0.5% CH3NH2
|
~ 0.05
|
0.051
|
0.031
|
0.005
|
0.164
|
0.009
|
|
0.5% HCN
|
< 0.10
|
0.023
|
0.008
|
0.005
|
0.157
|
0.000
|
|
0.5% CH4/ 0.25% N2
|
~ 0.45
|
0.017
|
0.061
|
0.017
|
0.018
|
0.028
|
|
0.5% CH4
|
~ 0.32
|
0.032
|
-
|
0.023
|
-
|
-
|
Table 6.2. Diamond growth rates and calculated mole fractions of major
stable species measured at filament temperatures (2400°C) for different C/N source gases. Note that the C:N ratio for all precursors
is 1:1.
(a) Methane and Ammonia as precursor gas
mixture
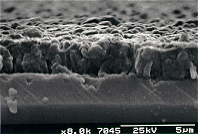
Scanning
electron micrographs (top and cross-sectional view) of films grown on silicon
(100) using a gas mixture of 0.5% CH4/0.5% NH3 (1:1
ratio) in H2 are shown in Figure 6.1. The growth rate (See Table 6.2) was calculated from the film
thickness, determined from the cross-sectional SEM image, divided by the time
of growth (6 hours). The film is
non-continuous, being composed of many isolated (111) diamond crystals. With methane-rich gas mixtures (e.g. 0.75%
CH4/0.25% NH3 in H2), as expected, diamond was
grown (See Figure 6.2), the morphology of which was similar to that observed in
standard CVD processes, although as the mole fraction of NH3
increased the films became more nanocrystalline in nature and the growth rate
reduced. As shown in Figure 6.3,6.19
with ammonia-rich gas mixtures, the Si substrate preferentially reacted with
the NH3 to produce an Si3N4 coating, with no
carbon. The deposition rate for gas
mixtures with C:N ratio of 1:1 is very small (less than 0.07 mm h-1). A composition diagram showing the types of films produced on Si
substrates after CVD as a function of different substrate temperatures and
methane:ammonia ratios is shown below in Figure 6.4.
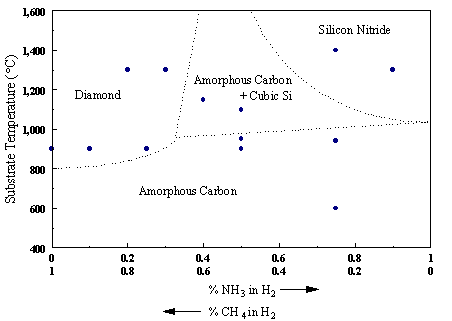
Figure 6.4. Diagram showing the types of films produced on Si substrates
after CVD as a function of different substrate temperatures and methane:ammonia
ratios. Approximate phase boundaries
are included to guide the eye (adapted from Reference 6.19).
(b) Methylamine as precursor gas mixture
The
concentration of methylamine (CH3NH2) was maintained at
0.5% in H2 to allow direct comparison with other C/N precursor gases
with a carbon-to-nitrogen ratio of 1:1.
Deposition under standard CVD conditions produced diamond films (See
Figure 6.5), but at a much lower growth rate. (~0.05 mm h-1)6.19
compared with that obtained when using 0.5% CH4 in H2
(~0.32 mm h-1). The film composed of mainly isolated (111)
faceted crystals.
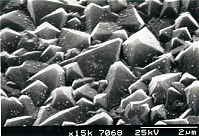
(c) Hydrogen cyanide as precursor gas mixture
Figure
6.6 shows that using 0.5% HCN in H2 under standard process
conditions produced amorphous films containing both diamond and SiC crystals,
but again the deposition rate was low (less than 0.1 mm h-1).6.19
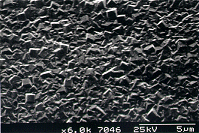
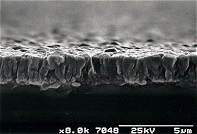
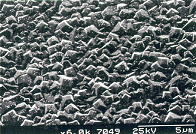
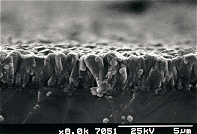
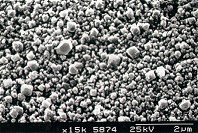 |  |
Figure 6.1(a). Scanning electron micrograph (SEM) of a film produced on silicon
after 6 h growth using input gas mixtures of 0.5% CH4/0.5% NH3
in hydrogen. | Figure 6.1(b). Scanning electron micrograph showing the cross sectional view of the
film. |
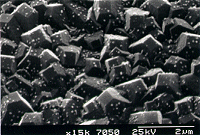
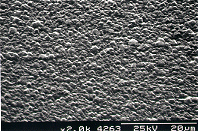 | 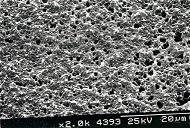 |
Figure 6.2. Scanning electron micrograph (SEM) of a polycrystalline diamond film produced
on silicon after 6 h growth using methane-rich gas mixtures (0.75% CH4/0.25%
NH3 in H2).6.19
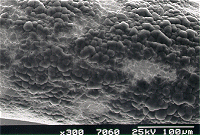
| Figure 6.3. Scanning electron micrograph (SEM) of a film produced on silicon
after 6 h growth using ammonia-rich gas mixtures (0.25% CH4/0.75%
NH3 in H2).6.19 |
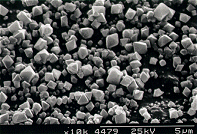 |  |
Figure 6.5. Scanning electron micrograph (SEM) of a film produced on silicon
after 6 h growth using input gas mixtures of 0.5% CH3NH2
in hydrogen.6.19
| Figure 6.6. Scanning electron micrograph (SEM) of a film produced on silicon
after 6 h growth using 0.5% HCN in hydrogen.6.19 |
(d) Methane and nitrogen as precursor gas
mixture
The
deposition rate and the resulting film quality at optimum growth temperature
(2400°C) depended on the choice of C/N precursor
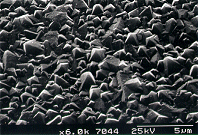
used. Inspection of Figure 6.7 reveals
that for a 1:1 C/N ratio in the feed gas, a continuous film was grown only by
CH4/N2 mixtures, showing predominantly (100) facets. Furthermore, the deposition rate is higher
than using standard CH4/H2 mixtures (Table 6.2). AES analysis of these films indicated that
reasonable quality diamond was deposited; however, no nitrogen was detected in
the bulk of the films, suggesting very low nitrogen-doping efficiency. This is consistent with the model of film
growth predicted by Jin and Moustakas which involves simultaneous deposition
and etching.6.1 SIMS
analysis, which is much more sensitive to nitrogen than AES, detected only very
small amounts of nitrogen in the films, consistent with results obtained by
Hong et al.6.17
With methane-rich gas
mixtures (e.g. 0.75% CH4/0.125% N2 in H2),
diamond was grown (See Figure 6.8), the morphology of which was again similar
to that observed in standard CVD processes.
As shown in Figure 6.9, continuous films were also produced with
nitrogen-rich gas mixtures (e.g. 0.25% CH4/0.375% N2 in H2),
although at reduced growth rates (See Table 6.3 (a) ).
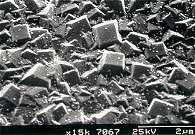
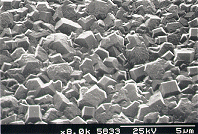 | 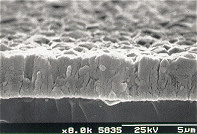 |
Figure 6.7 (a). Scanning electron micrograph (SEM) of a film produced on silicon
after 6 h growth using input gas mixtures of 0.5% CH4/0.25% N2
in hydrogen. | Figure 6.7 (b). Scanning electron micrograph showing the cross sectional view of the
film. |
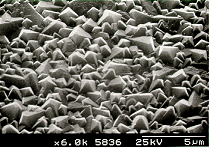 |  |
Figure 6.8 (a). Scanning electron
micrograph (SEM) of a film produced on silicon after 6 h growth using
methane-rich gas mixtures (0.75% CH4/0.125% N2 in H2). | Figure 6.8 (b). Scanning electron micrograph showing the cross sectional view of the
film. |
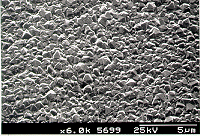 |  |
Figure 6.9 (a). Scanning electron
micrograph (SEM) of a film produced on silicon after 6 h growth using
nitrogen-rich gas mixtures (0.25% CH4/0.375% N2 in H2). | Figure 6.9 (b). Scanning electron micrograph showing the cross sectional view of the
film. |
| |
| |
Gas Flow Rates
H2:CH4:N2
(sccm)
|
N/C
|
N/C
(%)
|
N2/CH4
(%)
|
Growth Rate/ mm h-1
|
Surface
Morphology
|
|
(a)
100:0.5:0
|
0.00
|
0
|
0
|
0.32
|
C, O, T, (111)
|
|
100:0.5:0.25
|
1.00
|
100
|
50
|
0.45
|
C, Sq, (100)
|
|
100:0.75:0.125
|
0.34
|
34
|
17
|
0.45
|
C, O, (111)
|
|
100:0.25:0.375
|
3.00
|
300
|
150
|
0.23
|
C, O, (111)
|
|
(b)
100:1:0
|
0.00
|
0
|
0
|
0.5
|
C, O, T, (111)*
|
|
100:1:0.2
|
0.40
|
40
|
20
|
0.69
|
C, O, (111)
|
|
100:1:0.3
|
0.60
|
60
|
30
|
0.36
|
C, Sq, (111)
|
|
100:1:0.4
|
0.80
|
80
|
40
|
0.32
|
C, Sq, (100)
|
|
100:1:0.5
|
1.00
|
100
|
50
|
0.32
|
C, Sq, (100)
|
Table 6.3. Deposition rates and crystal morphology of films grown using
various H2/CH4/N2 gas mixtures: (a) Total [C]
and [N] = 1, but varying the [C]/[N] ratio; (b) 1% CH4 in N2/H2
mixture, the [N] varying between 0.2-0.5%.
(Keys used: C = continuous, O = octahedral, T = twinning, Sq =
square). * A top-view SEM image of the
film is shown in Figure 4.6 (a).
A series of deposition
experiments were performed to explore the effects of adding small amounts of
nitrogen (0.2-0.5%) to the standard 1% CH4 /H2 gas
mixture on the deposition rate and resulting crystal morphology of the diamond
films (Table 6.3 (b) ). Figure
6.10 shows the average growth rate as a function of the ratio of [N]/[C] in the
gas phase. The maximum growth rate was
observed at a [N]/[C] ratio of 40% and decreased for higher N
concentrations. It should be noted here
that growth rates measurements were unattainable for lower N concentrations
(< 40% [N]/[C]) due to the inability of the mass flow controllers to
regulate the N2 gas flow.
These trends are consistent with those observed by Refs. 6.12 and 6.16,
although the absolute values for the growth rates were different. Scanning electron micrographs of the films
grown using the above C/H/N gas mixtures (See Appendix III) revealed that 111
growth facets were observed for low N concentration (up to a [N]/[C] ratio of
60%), although as the concentration of N2 increased the films showed
predominantly (100) facets (See Figure 6.11).
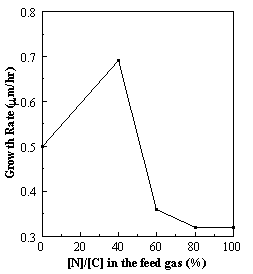 | 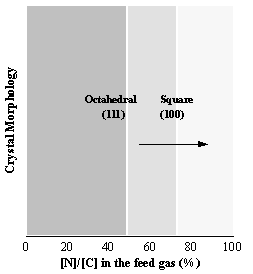 |
Figure 6.10. The growth rate
of diamond film as a function of nitrogen doping concentration. | Figure 6.11. The change in the crystal morphology of the diamond films as a function of [N]/[C]. |
The
red Raman spectra (632.8 nm), as a function of [N]/[C] in the gas phase,
are shown in Figure 6.12. The quality
of the diamond films are assessed by the 1332 cm-1 Raman line intensity.
The best quality films were produces with no added nitrogen. As the [N]/[C] ratio increases the quality
of the diamond decreases, consistent with results obtained by Prawer et al.6.16
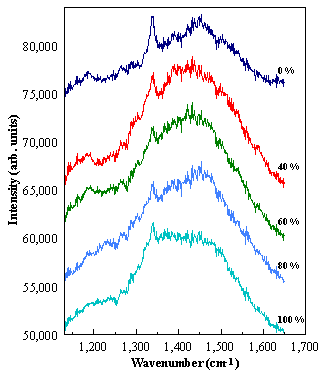
Figure 6.12. Raman spectra of diamond films grown with different [N2]
partial pressures. The spectra have
been displaced vertically for clarity.
The numbers marked on the figure are the values for the [N]/[C] in the
gas phase.
6.4 Gas composition versus filament temperature
for a variety of C-/N-containing precursor gases in H2
(a) Methane and Ammonia as source gas mixture
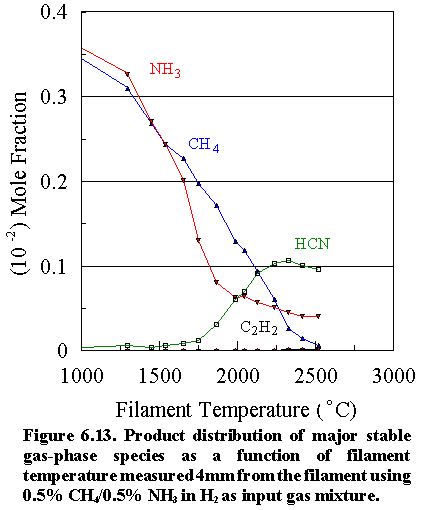
Figure
6.13 shows how the mole fractions of the major carbon and nitrogen containing
species gases [CH4 (m/e=16),
NH3 (m/e=17), C2H2
(m/e=26) and HCN (m/e=27)] vary as a function of filament
temperature for an initial feedstock of 0.5% CH4 + 0.5% NH3
in H2 measured 4 mm from the filament. The deposition rate under optimum growth
conditions is very low (<0.07 mm h-1),
because the dominant gas-phase reactions occurring between the C-containing and
N-containing species have the effect of ‘locking up’ the carbon in the form of
the stable cyanide product, HCN. The CH4
concentration steadily decreases with increasing filament temperature, whilst
the NH3 concentration drops sharply at ~1600°C.
The absolute concentrations of the two precursor gases in the vicinity
of the filament decrease not only as a result of chemical reactions but also
because of thermal diffusion effects inherent in multicomponent gas mixtures,5.25 whereby any temperature gradient induces the
heavier species in the mixture to move away from the higher temperature
regions. At ~1900°C filament temperature, the HCN concentration
increases rapidly, reaching a maximum value at the growth temperature (2400°C), significantly higher than that of either
of the two precursor gases. Interesting
to note is that very little N2 was detected; most of the N is locked
up either as unreacted NH3 or HCN (See Table 6.2).
A
prerequisite for the formation of HCN is the reaction between the C and N
containing precursor gases to create an initial C-N bond. This requires the
presence of ·CH3 and/or ·NH2
radicals. These species could result
from pyrolysis of the parent hydride or by H abstraction from methane and
ammonia by H atoms created at the filament as a result of the thermal
dissociation of H2.
Inspection of the available kinetic data6.21 suggests that at
all filament temperatures pyrolysis of NH3 is the dominant source of
·NH2, and that
both of the two reactions mentioned above contribute comparable amounts to the ·CH3 yield. Furthermore, the data show that at all
relevant temperatures the steady state ·NH2 concentration
exceeds [·CH3] by one or
two orders of magnitude. These radicals
can then undergo the following reactions:
CH4 + ·NH2 === CH3NH2
+ H· (6.1)
·CH3 + NH3
=== CH3NH2 + H· (6.2)
both producing methylamine, and hence the vital C-N
bond. The sharper decrease observed for
the NH3 concentration at lower temperatures is consistent with our
findings that [·NH2] >> [·CH3] and
therefore that reaction (6.1) is the preferred route to methylamine
formation. Once formed, the methylamine
can either redissociate or, more probably, undergo successive H abstractions to
produce HCN:
This
reaction is thermodynamically favourable due to the stability of the CºN bond.
No gas-phase methylamine or CH2=NH were detected in these
particular experiments, owing to their thermodynamic instability (and thus very
low steady state concentration) in the presence of high H atom concentrations,
[H]. Qualitatively, the chemistry
leading to HCN production is analogous to that for acetylene, which is the most
stable hydrocarbon product when using standard hydrocarbon/H2
mixtures and growth temperatures, regardless of the choice of hydrocarbon
precursor used.3.1 For a CH4/H2
gas mixture, the reaction is initiated by the ‘cracking’ of methane (by
hydrogen abstraction) to produce ·CH3
radicals. In such a case, where no ·NH2 radicals are
present, there is a greater steady-state [CH3] and the increased
likelihood of methyl recombination, followed by consecutive H abstractions
yields larger [C2H2].
Since the formation of [C2H2] depends on k[CH3]2,
the detection of large amounts of gas-phase acetylene in a hot filament CVD
reactor is generally taken as an indicator of steady state [CH3] and
thus of fast diamond film growth.
Inspection of Figure 6.13 shows that for a CH4/NH3
gas mixture, reactions leading to the formation of both HCºCH and HCºN are possible, though
acetylene was detected in only very small quantities. This implies that the above reaction scheme (6.1 and/or 6.2,
formed by 6.3) is the preferred route, leading to HCN formation. Furthermore, the presence of surplus ·NH2 radicals at
lower temperatures reduces the effective concentration of CHx
species, thus suppressing diamond deposition.

Quantitative measurements of the same
gas-phase species were performed with different CH4/NH3
ratios, but still maintaining 1% in H2. In a methane-rich mixture (e.g.
3:1 C/N ratio) the product distribution versus filament temperature shows
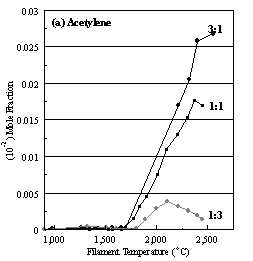
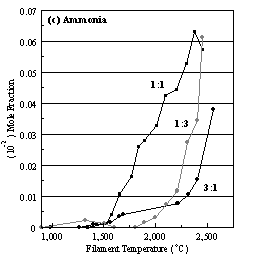
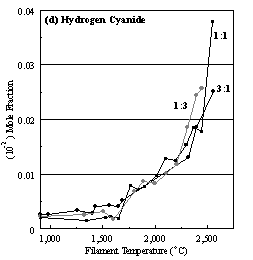
similar trends to that observed for a 1:1 stoichiometric mixture, except for a
considerable increase in the absolute acetylene concentration at growth
temperatures, consistent with higher diamond deposition rates.3.1,6.19 However, the HCN concentration, and its
variation with filament temperature, did not change with increasing [CH4]
in the source gas mixture, because the formation of HCN is limited by the
amount of NH3 in the feed gas.
Almost all the NH3 is converted to HCN, thus enabling any
excess methane in the gas-phase to take part in reactions leading to acetylene
formation, and hence diamond deposition (See Figure 6.14). In an ammonia-rich mixture (e.g. 1:3 C/N ratio), ·NH2 radicals are
present in much larger quantities and, as a result, reaction with CH4
will occur more readily forming CH3NH2 and ultimately
HCN. The prevalence of reaction (1) is
therefore likely to account for the fact that no acetylene was detected at any
given filament temperature and, consequently, no diamond deposition occurred
(See Figure 6.15). To a lesser extent,
ammonia gas itself also has a negative effect on the deposition rate because it
is capable of etching diamond from a growing surface during CVD.6.19
The way in which the concentrations of the major stable gas-phase species vary
as a function of filament temperature for the different CH4/NH3
ratios is shown in Figure 6.16.
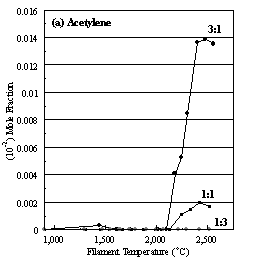
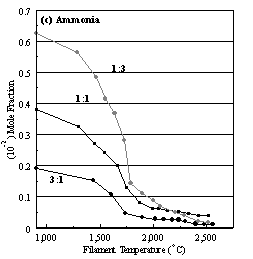
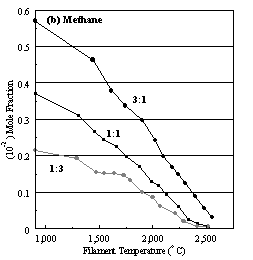
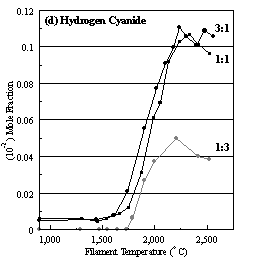
Figure 6.16. Product distribution of (a) acetylene, (b) methane, (c) ammonia
and (d) hydrogen cyanide as a function of filament temperature for different CH4/NH3
ratios in H2 as source gas mixtures (3:1, 1:1 and 1:3).
(b) Methylamine as source gas mixture
The product distribution of
the major stable species [CH4, NH3, C2H2
HCN and CH3NH2 (m/e=31)]
versus filament temperature for a 0.5% CH3NH2 initial
feedstock in H2 is shown in Figure 6.17. Here, the methylamine concentration diminishes rapidly at 1300°C, and above 1800°C almost all the CH3NH2
has disappeared, either via reaction
with H atoms (the reverse of reactions 6.1 and 6.2) producing CH4
and NH3, or via H atom
abstraction producing HCN. At filament
temperatures of ~2000°C the methane and ammonia
concentrations reach peak values. Above
2000°C their absolute concentrations decrease
because of thermal diffusion effects as well as chemical reactions (6.1) to
(6.3) to form HCN. Interesting to note
is the sharp rise in the HCN concentration at lower filament temperatures. This may be due to the inherent C-N bond in
the methylamine molecule which can convert readily to HCN in the presence of H
atoms, since the requirement of C-N bond formation via reactions (6.1) and (6.2) is by-passed. These reactions rely not only on the
production of ·CH3 and ·NH2 radicals,
which takes place at relatively high filament temperatures (~1700°C), but also on the relatively low
probability step of the two precursor species meeting and reacting
together. Competing reactions, such as
acetylene formation, are also significantly reduced, due to the ease by which
HCN is formed, thus accounting for the low deposition rate observed
(~0.05 mm h 1). In addition, at filament temperatures at and
above 2000°C, there is a secondary
increase in [HCN] when reactions (6.1) and (6.2) take place, between the
C- and N-containing species.
(c) Hydrogen cyanide as source gas mixture
Figure 6.18 shows how the
gas composition for an initial feedstock of 0.5% HCN changes versus filament
temperature. Compared to ammonia and
methylamine, a much more gradual decrease in the HCN concentration is observed
as a function of filament temperature, owing to its thermodynamic
stability. Thermal diffusion effects
account for most of the reduction in the absolute concentration measured as a
function of filament temperature.
However, the fact that diamond could be deposited using hydrogen cyanide
gas shows that some cycling of the carbon must be occurring, and evidence for
this is shown in the detection of trace amounts of CH4, NH3
and C2H2. The
deposition rate is again very low (<0.1 mm h-1) due
to the preferential regeneration of HCN by reactions between the C- and
N-containing species at higher temperatures.
(d) Methane and nitrogen as source gas
mixtures

Figure
6.19 shows the characterisation of the gas-phase environment and its variation
with filament temperature for an initial feedstock of 0.5% CH4/0.25%
N2 in H2, such that the C:N ratio is again maintained at
1:1 during analysis. The methane and
nitrogen concentrations decrease steadily with filament temperature,
accompanied by a rise in HCN, C2H2, CH3NH2
and NH3 concentrations at ~1700°C. The attenuation of the absolute mole fractions measured for both
precursors with increasing filament temperature is again largely a result of
thermal diffusion effects. Comparison
of the relative concentrations of these major stable species measured at
optimum filament temperatures (see Table 6.2) indicates that for a CH4/N2
gas mixture, the acetylene concentration is around an order of magnitude
greater than that of the other C/N precursor gases, whilst the HCN
concentration is reduced by a factor of ~4.
The prevalent N-containing species in the gas-phase is NH3,
not HCN. The differences in the species
composition can be explained in terms of the effects N2 molecules
have on the gas-phase chemistry and the way in which the C is locked up in the
CVD process at different temperatures.
At
lower temperatures (~1600°C), unlike CH4/NH3
gas mixtures, very few ·NH2 radicals will
form because the dissociation of the strong NºN bonds requires much more
energy. However, ·CH3 radicals will
arise from a H + CH4 abstraction reaction as in the normal
hydrocarbon/H2 CVD process, and be free to undergo recombination and
H abstraction reactions to form acetylene.
The result is that not only the formation of HCN is reduced, (because
reactions (6.1) to (6.3) are now terminated), but competing C1
reactions to produce C2 species are far less restrained. Thus at lower temperatures, N2 is
seen as being virtually a spectator to the CVD process.
At
higher temperatures (>1600°C), addition of N2
results in a slightly higher deposition rate (Table 6.2) but of poorer quality
diamond (as determined by LRS). This is
consistent with the results obtained by Jin and Moustakas,6.1 when
using similar amounts of N2 in the feed gas. We believe that this might be explicable if
N2 is acting as a catalyst, effectively scavenging H atoms and
returning them to the gas system as H2. This will be a multi-step process, such as:
(M = N2/H2)
Analogous
hydrogenation reactions could occur to produce N2H4, and
the weak N-N bond will then be susceptible to fission and NH3
formation. All of these reaction steps
are reversible, but would require H abstraction, initiated by yet another H
atom to occur. For example:

The
net effect of such a catalytic scheme would be that the introduction of only a
small amount of N2 (<0.5%) in the system could lead to removal of
a significant amount of H atoms, thereby slowing all the subsequent gas-phase
chemistry. Thus all the reactions which
depend upon high H atom concentrations would be reduced (e.g. reactions 6.1-6.3), resulting in the observed depletion in HCN
compared to the amounts seen with the other gas additions. The unusually high methylamine concentration
observed at high filament temperatures could also be explained by the fact that
the attenuation of H atom concentration reduces the effective H abstraction
reactions of existing methylamine species, thus allowing higher steady state
concentrations.

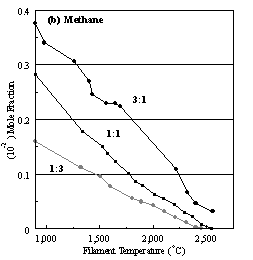
Quantitative measurements of
the same gas-phase species were performed with different CH4/N2
ratios, but still maintaining 1% in H2. In a methane-rich mixture (e.g.
3:1 C/N ratio) the product distribution versus filament temperature shows
similar trends to that observed for a 1:1 stoichiometric mixture, except for an
increase in the absolute acetylene (and ethylene) concentration at growth
temperatures. However, the HCN and CH3NH2
concentrations and their variation with filament temperature, did not change
with increasing [CH4] in the source gas mixture, presumably because
the formation of these species depends on the amount of N2 in the
feed gas. In a nitrogen-rich mixture (e.g.
1:3 C/N ratio), a decrease in [CH3], [C2H2]
and [C2H4] were observed, consistent with lower
deposition rates. In addition the HCN,
and CH3NH2 concentration, and their variation with
filament temperature, did not change with increasing [N2] in the
source gas mixture, because the formation of these species also depends on the
amount of CH4 in the feed gas. The way in which the concentrations
of the major stable gas-phase species vary as a function of filament
temperature for the different CH4:N2 ratios is shown in
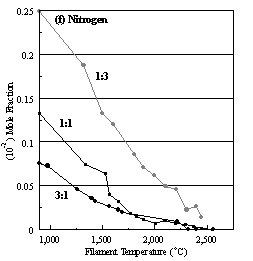
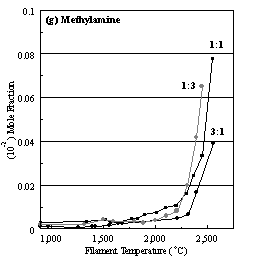
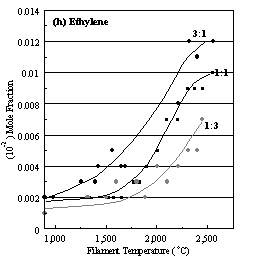
Figure 6.22.
Figure 6.22. Product distribution of (a) acetylene, (b) methane, (c) ammonia,
(d) hydrogen cyanide, (e) methyl radical, (f) nitrogen, (g) methylamine, and
(h) ethylene, as a function of filament temperature for different CH4/N2
ratios in H2 as source gas mixtures (3:1, 1:1 and 1:3).
Additional
MBMS measurements were performed which showed that increasing the N2
concentration (for a given C/H2 mixture) further suppresses HCN,
while allowing the presence of increasing concentrations of both NH3
and CH3NH2. This
theory is in good agreement with observations of Hong et al.6.17 who found that the amount of atomic hydrogen
decreased relative to the increase of nitrogen.
These observations are also compatible with the proposed
gas phase sequence (6.4) - (6.6) involving catalytic destruction of H
by N2. The rates for
reactions (6.4) and (6.5) at standard growth temperatures are 1012-1013
cm3 mol-1 s-1,6.23 which
are similar in magnitude to that for most of the other nitrogen gas-phase
reactions in this system,6.24 which would suggest that reactions
(6.4) and (6.5) might take place readily under the process conditions. Indeed, Bozzelli and Dean6.23
state that when the H atom mole fraction is high, i.e. under high temperature reaction conditions, N2H
formation from H + N2 is very rapid. Thus we could anticipate equilibrium, or near equilibrium
concentrations of N2H which might be high enough to undergo
bimolecular reactions with other important radical species, in our case
hydrogen atoms, ·H. The driving force in this rapid cycling of N2 ® N2H ® N2 is the very strong and stable
NºN bond.
However, inspection of Figure 6.19 shows that less thermodynamically
favourable side reactions do occur to produce NH3, CH3NH2
and ultimately HCN.
As
a final piece of supporting evidence for the H atom depletion mechanism we
observe that increasing N2 concentrations lead to diamond films of
poorer quality, as evidenced by LRS.
This is consistent with there being a reduction in the H atoms required
to etch away the non-diamond phases on the film surface. Hong et
al.6.17 also found that increasing the N2
concentration reduces the growth rate, partly as a result of the additional
etching caused by NH3, but probably also because of a decrease in
available atomic H.
All
of this speculation relies on the assumption of a purely gas phase mechanism
and a sufficient stability for the (as yet) poorly characterised N2H
intermediate. However, preliminary
measurements of H atom concentrations using laser spectroscopy techniques6.25
in a similar hot filament CVD reactor suggest negligible depletion of [H]. If correct, we would need to consider
alternative explanation(s) for the observations. These are likely to involve heterogeneous chemistry, initiated by
N2 decomposition on the filament surface, or, possibly, on the
(cooled) growing diamond surface to produce N atoms. A subsequent reaction such as:

in the gas phase or on the surface could be followed
by further reduction to NH3 whilst HCN formation could arise (in
part at least) by H atom abstraction of CN terminating groups on the surface:
which has been proposed as one route to C2H2
formation.6.26
6.5 Conclusions
The
effects of nitrogen on the CVD diamond growth mechanism have been investigated
using in-situ molecular beam mass
spectrometry. The deposition rate at optimum growth conditions depends
critically on the choice of C/N precursor used, and the origin of the
carbon-containing species. The
reactions occurring in the gas-phase seem to lead predominantly to the
formation of HCN, (except for CH4/N2 gas mixtures). The stability of this species precludes most
of the cycling of carbon during the CVD process, resulting in low rates of
diamond deposition. Thermodynamic equilibrium
calculations5.16 confirm that HCN production is highly favoured in
H/C/N gas mixtures at high gas processing temperatures.
For
a 1:1 C:N ratio in the feed gas, continuous films were produced after
6 hours deposition only by CH4/H2/N2 gas
mixtures. Incorporation of nitrogen in
the grown diamond films was very low, consistent with the conclusions of Jin
and Moustakas,6.1 who calculated a theoretical value for the doping
efficiency of nitrogen in diamond of around 10-4. At lower temperatures N2 simply
acts as a spectator to the CVD process, as evidenced by the significant increase
in the C2H2 concentration and reduction in the HCN
concentration in the gas-phase compared to other N source gas additions. At optimum filament temperatures (~2400°C), addition of N2 to a CH4/H2
gas mixture leads to higher deposition rates of poor quality diamond films
(determined by LRS). We suggest that
this might be explicable if N2 is acting as a catalyst for the
destruction of H atoms, thereby reducing the etching rate of non-diamond phases
on the film surface. However, recent
laser spectroscopy analysis suggests that the [H] concentration is relatively
insensitive to addition of trace N2; thus we also consider whether
the observations may reflect gas-surface heterogeneous chemistry. In either case, addition of a tiny amount of
N2 to the hot filament CVD process will affect not only the
chemistry occurring under standard deposition conditions, but the growth rate,
the morphology and the quality of the resulting diamond films. As a consequence it is clear that the
diamond CVD process is likely to be more dependent on gas purity and ultimate
vacuum than has often been appreciated.
6.6 References
6.1 S. Jin, and T.D. Moustakas, Appl. Phys.
Lett., 65, 403 (1994).
6.2 L. Bergman, M.T. McClure, J.T. Glass, and
R.J. Nemanich, J. Appl. Phys., 76 3020
(1994).
6.3 R. Samlenski, C. Haug, R. Brenn, C. Wild,
R. Locher, and P. Koidl, Appl. Phys. Lett., 67, 2798 (1995).
6.4 E. Boettger, A. Bluhm, X. Jiang, L.
Schafer, and C.-P. Klages, J. Appl. Phys.,77
6332 (1995).
6.5 J. Mort, M.A. Machonkin, and K. Okumura,
Appl. Phys. Lett., 59, 3148 (1991).
6.6 K. Okano, S. Koizumi, S.R.P. Silva, and
G.A.J. Amaratunga, Nature, 381, 140 (1996).
6.7 M.W. Geis, J.C. Twichell, N.N. Efremow,
K. Krohn, and T.M. Lyszczarz, Appl. Phys. Lett., 68, 2294 (1996).
6.8 G.A.J. Amaratunga and S.R.P. Silva, Appl.
Phys. Lett., 68, 2529 (1996).
6.9 S.R.P. Silva, B. Rafferty, G.A.J.
Amaratunga, J. Schwan, D.F. Franceschini, and L.M. Brown, Diamond and Relat.
Mater., 5, 401 (1996).
6.10 P. Ball, Nature, 381, 116 (1996).
6.11 S.Jin and T.D. Moustakas, Appl. Phys.
Lett., 63, 2354 (1993).
6.12 S. Bohr, R. Haubner, and B. Lux, Appl. Phys
Lett., 68, 1075 (1996).
6.13 L. Locher, C. Wild, N. Herres, D. Behr, and
P. Koidl, Appl. Phys. Lett., 65, 34 (1994).
6.14 G.Z. Cao, J.J. Schermer, W.J.P. van Enckevort,
W.A.L.M. Elst, and L.J. Giling, J. Appl. Phys., 79 1357 (1996).
6.15 A. Badzian, T. Badzian, and S.-T Lee, Appl.
Phys Lett., 62, 3432 (1993).
6.16 S. Prawer, T.L. McCormick, W.B. Alexander,
L.E. Seitzman, and J.E. Butler, in
preparation.
6.17 T-M. Hong, S-H Chen, Y-S Chion and C-F
Chen, Thin Solid Films, 270, 148 (1995).
6.18 T-M. Hong, S-H Chen, Y-S Chion and C-F
Chen, Appl. Phys Lett., 67, 2149 (1995).
6.19 P.W. May, P.R. Burridge, C.A. Rego, R.S.
Tsang, M.N.R. Ashfold, K.N. Rosser, R.E. Tanner, D. Cherns and R. Vincent,
Diamond and Relat. Mater., 5, 354
(1996).
6.20 R.S. Tsang, C.A. Rego, P.W. May, in
preparation.
6.21 S.M. Hwang, T. Higashihara, K.S. Shin and
W.C. Gardiner, Jr., J. Phys. Chem., 94,
2883 (1990).
6.22 H. Ellis (ed.), Nuffield Advanced
Science Book of Data 4th edn., Longman, 1986.
6.23 J.W. Bozzelli and A.M. Dean, Int. J. Chem.
Kinet., 27, 1097 (1995).
6.24 J.A. Miller, M.D. Smooke, R.M. Green and
R.J. Kee, Comb. Sci. and Tech., 34, 149
(1983).
6.25 S.A. Redman and M.N.R. Ashfold, unpublished
results.
6.26 J.E. Butler and R.L. Woodin, Phil. Trans.
R. Soc. Lond. A, 342 209 (1993).
6.7 Appendix
(I) Synthesis of Hydrogen
Cyanide
All
the precursors examined in the present study were obtained as commercial
products except for HCN, which was synthesised by the reaction of NaCN with
phosphoric acid in vacuo:
NaCN (s) + H3PO4
(l) (excess) ® HCN (g) + Na3PO4
(l)
The phosphoric acid was first dried by gradual
addition of phosphorus pentoxide (P2O5) until the liquid
became viscous. Phosphoric acid was
used in preference to other acids to allow a sensible rate of reaction. The reaction was executed using vacuum line
techniques at a pressure of ~0.001 Torr (See Figure II). The dried H3PO4 was
introduced into round-bottomed flask #1 containing the NaCN (1g, 0.02 moles) via a dropping funnel. The reaction occurred spontaneously
releasing HCN gas, which passed through the vacuum line to round-bottomed flask
#2. Attached to this flask was a “cold
finger” (immersed in liquid nitrogen) which was used to condense the HCN
gas. When the reaction mixture stopped
effervescing, and the reaction had completed, the round-bottomed flask was
isolated from the vacuum system to allow the HCN to revert to a gas. Assuming the reaction went to completion,
the expected yield for HCN would be 0.45 dm3 at room
temperature and pressure.
Figure I. Vacuum line apparatus used for the synthesis
of HCN.
(II) Ionization
potentials (taken from Reference 3.19) and the user selected electron energies
of the various gas-phase species monitored.
|
Precursor
Gas
|
Chemical
Formula
|
Ionization
Potential (eV)
|
User Selected
Electron Energy (eV)
|
|
Methyl radical
|
CH3
|
9.84
|
13.5
|
|
Methane
|
CH4
|
12.98
|
14.8
|
|
Ethylene
|
C2H4
|
10.51
|
14.8
|
|
Acetylene
|
C2H2
|
11.41
|
16.8
|
|
Ammonia
|
NH3
|
10.15
|
14.8
|
|
Methylamine
|
CH3NH2
|
8.97
|
16.8
|
|
Hydrogen cyanide
|
HCN
|
13.73
|
16.8
|
|
Nitrogen
|
N2
|
15.55
|
30.0
|
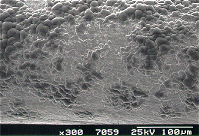
(III) SEM Photo Library
 | 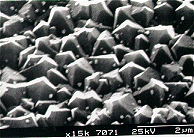 |
Scanning electron micrograph (SEM) of a film
produced on silicon after 6 h growth using input gas mixtures of 1% CH4
and 0.2% N2 in hydrogen. | A close up view of the film
surface. The white spots are Si debris
found on the surface after the substrate was cleaved in preparation for the SEM
analysis. |
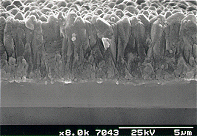 |  |
Scanning electron micrograph
showing the cross sectional view of the film. | SEM of the filament surface after 6 h growth
using input gas mixtures of 1% CH4 and 0.2% N2 in
hydrogen. When the [N]/[C] ratio in the
gas phase increases, the condition of the filament gradually deteriorates, as
shown in the subsequent SEM photos.
This may be due to etching reactions occurring between the filament and
NH3, which become more pronounced at higher [N]/[C] ratios, as more
NH3 is formed in the gas phase (revealed by MBMS analysis). |
 |  |
Scanning electron micrograph (SEM) of a film
produced on silicon after 6 h growth using input gas mixtures of 1% CH4
and 0.3% N2 in hydrogen. | A close up view of the film
surface. |
 |  |
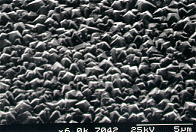
Scanning electron micrograph
showing the cross sectional view of the film. | SEM of the filament surface
after 6 h growth using input gas mixtures of 1% CH4 and 0.3% N2
in hydrogen. |
 |  |
Scanning electron micrograph
(SEM) of a film produced on silicon after 6 h growth using input gas
mixtures of 1% CH4 and 0.4% N2 in hydrogen. | A close up view of the film
surface. |
 |  |
Scanning electron micrograph
showing the cross sectional view of the film. | SEM of the filament surface
after 6 h growth using input gas mixtures of 1% CH4 and 0.4% N2
in hydrogen. |
 |  |
Scanning electron micrograph
(SEM) of a film produced on silicon after 6 h growth using input gas
mixtures of 1% CH4 and 0.5% N2 in hydrogen. | A close up view of the film
surface. |
 |  |
Scanning electron micrograph
showing the cross sectional view of the film. | SEM of the filament surface
after 6 h growth using input gas mixtures of 1% CH4 and 0.5% N2
in hydrogen. The dark grey nodules present on the filament surface are currently being analysed; but the initial guess is that these nodules could be tantalum nitride, formed as a result of reactions between the Ta filament
and NH3. |
(IV) Experimental Data
The
following experimental values have been converted from raw MBMS data into
species mole fractions as a function of filament temperature for the various
precursor gases examined in this chapter.
The species concentration are presented with no correction being made as
a result of thermal diffusion.
0.5% CH4
& 0.5% NH3 in H2 at 20 Torr vs. Filament Temperature
MS Probe Parameters: -6%
(DISCRIM), -20% (DELTAM), -40% (RES’N), 2600V (SEM), 3.0V (CAGE), 140 mA
(EMISS).
MS Pressure = 2.7x10⁻⁶
Torr
Species Mole Fractions vs. Filament Temperature
|
Fil. Temp
(°C)
|
CH4
(14.8eV)
|
NH3
(14.8eV)
|
C2H4
(14.8eV)
|
C2H2
(16.8eV)
|
HCN
(16.8eV)
|
|
23
|
0.500
|
0.500
|
0.004
|
0.000
|
0.000
|
|
1300
|
0.310
|
0.326
|
0.003
|
0.000
|
0.006
|
|
1450
|
0.270
|
0.271
|
0.002
|
0.000
|
0.005
|
|
1540
|
0.244
|
0.244
|
0.003
|
0.000
|
0.006
|
|
1660
|
0.227
|
0.202
|
0.002
|
0.000
|
0.009
|
|
1750
|
0.197
|
0.131
|
0.004
|
0.000
|
0.012
|
|
1870
|
0.172
|
0.081
|
0.005
|
0.000
|
0.031
|
|
1990
|
0.129
|
0.064
|
0.007
|
0.000
|
0.061
|
|
2050
|
0.119
|
0.064
|
0.006
|
0.000
|
0.070
|
|
2130
|
0.094
|
0.057
|
0.008
|
0.000
|
0.092
|
|
2240
|
0.060
|
0.052
|
0.009
|
0.001
|
0.103
|
|
2330
|
0.026
|
0.046
|
0.007
|
0.002
|
0.107
|
|
2420
|
0.014
|
0.040
|
0.007
|
0.002
|
0.101
|
|
2520
|
0.006
|
0.041
|
0.007
|
0.002
|
0.097
|
0.75% CH4 & 0.25% NH3
in H2 at 20 Torr vs. Filament Temperature
MS Probe Parameters: -6%
(DISCRIM), -20% (DELTAM), -40% (RES’N), (SEM), 3.0V (CAGE), 140mA
(EMISS).
MS Pressure = 2.3x10⁻⁶
Torr
Species Mole Fractions vs. Filament Temperature
|
Fil. Temp
(°C)
|
CH4
(14.8eV)
|
NH3
(14.8eV)
|
C2H4
(14.8eV)
|
C2H2
(16.8eV)
|
HCN
(16.8eV)
|
|
23
|
0.750
|
0.250
|
0.000
|
0.000
|
0.000
|
|
1440
|
0.463
|
0.152
|
0.000
|
0.000
|
0.005
|
|
1610
|
0.378
|
0.109
|
0.000
|
0.000
|
0.008
|
|
1740
|
0.337
|
0.045
|
0.000
|
0.000
|
0.021
|
|
1900
|
0.297
|
0.034
|
0.000
|
0.000
|
0.056
|
|
2020
|
0.241
|
0.029
|
0.002
|
0.000
|
0.077
|
|
2100
|
0.199
|
0.028
|
0.003
|
0.000
|
0.091
|
|
2180
|
0.169
|
0.026
|
0.006
|
0.004
|
0.100
|
|
2240
|
0.149
|
0.026
|
0.007
|
0.005
|
0.110
|
|
2300
|
0.125
|
0.021
|
0.006
|
0.008
|
0.106
|
|
2400
|
0.090
|
0.013
|
0.009
|
0.014
|
0.101
|
|
2480
|
0.056
|
0.011
|
0.007
|
0.014
|
0.109
|
|
2560
|
0.032
|
0.012
|
0.006
|
0.014
|
0.106
|
0.25% CH4
& 0.75% NH3 in H2 at 20 Torr vs. Filament Temperature
MS Probe Parameters: -6%
(DISCRIM), 0% (DELTAM), -40% (RES’N), 2600V (SEM), 3.0V (CAGE), 140mA
(EMISS).
MS Pressure = 2.0x10⁻⁶
Torr
Species Mole Fractions vs. Filament Temperature
|
Fil. Temp
(°C)
|
CH4
(14.8eV)
|
NH3
(14.8eV)
|
C2H4
(14.8eV)
|
C2H2
(16.8eV)
|
HCN
(16.8eV)
|
|
23
|
0.250
|
0.750
|
0.000
|
0.000
|
0.000
|
|
1290
|
0.194
|
0.565
|
0.000
|
0.000
|
0.000
|
|
1470
|
0.156
|
0.484
|
0.000
|
0.000
|
0.000
|
|
1550
|
0.152
|
0.415
|
0.000
|
0.000
|
0.000
|
|
1640
|
0.152
|
0.367
|
0.000
|
0.000
|
0.000
|
|
1730
|
0.146
|
0.281
|
0.000
|
0.000
|
0.000
|
|
1790
|
0.132
|
0.143
|
0.000
|
0.000
|
0.006
|
|
1900
|
0.100
|
0.112
|
0.000
|
0.000
|
0.027
|
|
2000
|
0.087
|
0.089
|
0.004
|
0.000
|
0.037
|
|
2070
|
0.062
|
0.069
|
0.000
|
0.000
|
0.038
|
|
2210
|
0.042
|
0.051
|
0.004
|
0.000
|
0.050
|
|
2290
|
0.020
|
0.041
|
0.004
|
0.000
|
0.042
|
|
2420
|
0.006
|
0.022
|
0.005
|
0.000
|
0.040
|
|
2520
|
0.006
|
0.018
|
0.001
|
0.000
|
0.038
|
0.5% CH3NH2 in H2
at 20 Torr vs. Filament Temperature
MS Probe Parameters: -4%
(DISCRIM), -20% (DELTAM), -40% (RES’N), 2600V (SEM), 3.0V (CAGE), 140mA
(EMISS).
MS Pressure = 8x10⁻⁷
Torr
Species Mole Fractions vs. Filament Temperature
|
Fil. Temp
(°C)
|
CH4
(14.8eV)
|
NH3
(14.8eV)
|
CH3NH2
(16.8eV)
|
C2H2
(16.8eV)
|
HCN
(16.8eV)
|
|
23
|
0.000
|
0.000
|
0.500
|
0.000
|
0.000
|
|
960
|
0.008
|
0.023
|
0.193
|
0.001
|
0.041
|
|
1230
|
0.009
|
0.035
|
0.144
|
0.001
|
0.064
|
|
1420
|
0.018
|
0.042
|
0.103
|
0.001
|
0.082
|
|
1540
|
0.032
|
0.041
|
0.066
|
0.001
|
0.163
|
|
1700
|
0.055
|
0.051
|
0.044
|
0.002
|
0.163
|
|
1810
|
0.088
|
0.058
|
0.025
|
0.001
|
0.157
|
|
1930
|
0.114
|
0.062
|
0.019
|
0.002
|
0.152
|
|
2030
|
0.131
|
0.057
|
0.013
|
0.002
|
0.141
|
|
2100
|
0.113
|
0.049
|
0.009
|
0.002
|
0.156
|
|
2175
|
0.090
|
0.044
|
0.004
|
0.002
|
0.155
|
|
2300
|
0.072
|
0.034
|
0.006
|
0.003
|
0.165
|
|
2400
|
0.051
|
0.031
|
0.009
|
0.005
|
0.164
|
|
2500
|
0.033
|
0.030
|
0.007
|
0.006
|
0.172
|
0.5% HCN in H2
at 20 Torr vs. Filament Temperature
MS Probe Parameters: -4%
(DISCRIM), -20% (DELTAM), -40% (RES’N), 2600V (SEM), 3.0V (CAGE), 140mA
(EMISS).
MS Pressure = 8x10⁻⁷
Torr
Species Mole Fractions vs. Filament Temperature
|
Fil. Temp
(°C)
|
CH4
(14.8eV)
|
NH3
(14.8eV)
|
C2H2
(16.8eV)
|
HCN
(16.8eV)
|
|
23
|
0.000
|
0.000
|
0.000
|
0.500
|
|
1040
|
0.002
|
0.002
|
0.001
|
0.304
|
|
1410
|
0.002
|
0.002
|
0.001
|
0.255
|
|
1590
|
0.013
|
0.003
|
0.001
|
0.217
|
|
1660
|
0.020
|
0.004
|
0.002
|
0.191
|
|
1830
|
0.032
|
0.008
|
0.002
|
0.177
|
|
1940
|
0.034
|
0.007
|
0.002
|
0.155
|
|
2040
|
0.029
|
0.007
|
0.002
|
0.141
|
|
2100
|
0.026
|
0.007
|
0.002
|
0.136
|
|
2180
|
0.027
|
0.006
|
0.003
|
0.138
|
|
2300
|
0.024
|
0.007
|
0.004
|
0.144
|
|
2420
|
0.022
|
0.008
|
0.005
|
0.159
|
0.5% CH4
& 0.25% N2 in H2 at 20 Torr vs. Filament Temperature
MS Probe Parameters: -3%
(DISCRIM), -20% (DELTAM), -40% (RES’N), (SEM), 3.0V (CAGE), 140mA
(EMISS).
MS Pressure = 8x10⁻⁷
Torr
Species Mole Fractions vs. Filament Temperature
|
Fil. Temp
(°C)
|
CH3
13.5eV
|
CH4
14.8eV
|
NH3
14.8eV
|
C2H4
14.8eV
|
C2H2
16.8eV
|
HCN
16.8eV
|
CH3 NH2
16.8eV
|
N2
30.0eV
|
|
25
|
0.000
|
0.500
|
0.000
|
0.000
|
0.000
|
0.000
|
0.000
|
0.250
|
|
1340
|
0.009
|
0.178
|
0.000
|
0.002
|
0.000
|
0.002
|
0.003
|
0.075
|
|
1525
|
0.011
|
0.150
|
0.001
|
0.002
|
0.000
|
0.002
|
0.004
|
0.053
|
|
1570
|
0.011
|
0.138
|
0.004
|
0.002
|
0.000
|
0.002
|
0.003
|
0.041
|
|
1650
|
0.012
|
0.123
|
0.011
|
0.002
|
0.000
|
0.002
|
0.003
|
0.032
|
|
1769
|
0.012
|
0.102
|
0.016
|
0.003
|
0.002
|
0.008
|
0.005
|
0.018
|
|
1830
|
0.013
|
0.087
|
0.026
|
0.003
|
0.003
|
0.007
|
0.005
|
0.015
|
|
1895
|
0.012
|
0.079
|
0.028
|
0.004
|
0.005
|
0.008
|
0.007
|
0.012
|
|
2010
|
0.017
|
0.063
|
0.033
|
0.005
|
0.008
|
0.010
|
0.008
|
0.007
|
|
2098
|
0.017
|
0.056
|
0.0423
|
0.007
|
0.011
|
0.013
|
0.010
|
0.010
|
|
2200
|
0.023
|
0.044
|
0.045
|
0.007
|
0.013
|
0.013
|
0.010
|
0.007
|
|
2297
|
0.025
|
0.031
|
0.053
|
0.009
|
0.015
|
0.016
|
0.016
|
0.006
|
|
2370
|
0.026
|
0.023
|
0.063
|
0.009
|
0.018
|
0.019
|
0.024
|
0.003
|
|
2450
|
0.021
|
0.008
|
0.057
|
0.009
|
0.017
|
0.018
|
0.033
|
0.001
|
0.75% CH4 & 0.125% N2
in H2 at 20 Torr vs. Filament Temperature
MS Probe Parameters: -3%
(DISCRIM), -20% (DELTAM), -40% (RES’N), 2600V (SEM), 3.0V (CAGE), 140mA (EMISS).
MS Pressure = 9x10⁻⁷
Torr
Species Mole Fractions vs. Filament Temperature
|
Fil. Temp
(°C)
|
CH3
13.5eV
|
CH4
14.8eV
|
NH3
14.8eV
|
C2H4
14.8eV
|
C2H2
16.8eV
|
HCN
16.8eV
|
CH3 NH2
16.8eV
|
N2
30.0eV
|
|
24
|
0.000
|
0.750
|
0.000
|
0.000
|
0.000
|
0.000
|
0.000
|
0.125
|
|
900
|
0.002
|
0.375
|
0.000
|
0.002
|
0.000
|
0.003
|
0.001
|
0.075
|
|
980
|
0.002
|
0.340
|
0.000
|
0.002
|
0.000
|
0.003
|
0.001
|
0.073
|
|
1260
|
0.004
|
0.306
|
0.000
|
0.003
|
0.000
|
0.003
|
0.001
|
0.046
|
|
1400
|
0.005
|
0.270
|
0.001
|
0.003
|
0.000
|
0.003
|
0.001
|
0.037
|
|
1430
|
0.006
|
0.245
|
0.001
|
0.004
|
0.000
|
0.004
|
0.001
|
0.032
|
|
1565
|
0.006
|
0.229
|
0.002
|
0.005
|
0.000
|
0.004
|
0.001
|
0.027
|
|
1650
|
0.008
|
0.228
|
0.004
|
0.004
|
0.000
|
0.004
|
0.003
|
0.023
|
|
1690
|
0.012
|
0.224
|
0.004
|
0.004
|
0.000
|
0.005
|
0.002
|
0.019
|
|
2215
|
0.018
|
0.109
|
0.008
|
0.008
|
0.017
|
0.012
|
0.005
|
0.009
|
|
2320
|
0.024
|
0.067
|
0.011
|
0.012
|
0.021
|
0.014
|
0.006
|
0.000
|
|
2400
|
0.028
|
0.046
|
0.015
|
0.011
|
0.026
|
0.019
|
0.017
|
0.000
|
|
2560
|
0.032
|
0.032
|
0.038
|
0.012
|
0.027
|
0.0255
|
0.039
|
0.000
|
0.25% CH4
& 0.375% N2 in H2 at 20 Torr vs. Filament Temperature
MS Probe Parameters: -3%
(DISCRIM), -20% (DELTAM), -40% (RES’N), (SEM), 3.0V (CAGE), 140mA
(EMISS).
MS Pressure = 8x10⁻⁷
Torr
Species Mole Fractions vs. Filament Temperature
|
Fil. Temp
(°C)
|
CH3
13.5eV
|
CH4
14.8eV
|
NH3
14.8eV
|
C2H4
14.8eV
|
C2H2
16.8eV
|
HCN
16.8eV
|
CH3 NH2
16.8eV
|
N2
30.0eV
|
|
23
|
0.000
|
0.250
|
0.000
|
0.000
|
0.000
|
0.000
|
0.000
|
0.375
|
|
900
|
0.002
|
0.160
|
0.000
|
0.001
|
0.000
|
0.002
|
0.002
|
0.249
|
|
1323
|
0.003
|
0.113
|
0.002
|
0.002
|
0.000
|
0.003
|
0.002
|
0.187
|
|
1503
|
0.004
|
0.096
|
0.001
|
0.002
|
0.000
|
0.003
|
0.004
|
0.132
|
|
1602
|
0.005
|
0.078
|
0.000
|
0.003
|
0.000
|
0.002
|
0.003
|
0.120
|
|
1805
|
0.007
|
0.056
|
0.000
|
0.003
|
0.000
|
0.007
|
0.003
|
0.086
|
|
1890
|
0.008
|
0.049
|
0.001
|
0.002
|
0.001
|
0.009
|
0.003
|
0.071
|
|
2000
|
0.011
|
0.043
|
0.003
|
0.004
|
0.003
|
0.008
|
0.004
|
0.061
|
|
2107
|
0.012
|
0.032
|
0.007
|
0.003
|
0.004
|
0.010
|
0.006
|
0.049
|
|
2210
|
0.015
|
0.021
|
0.012
|
0.004
|
0.003
|
0.012
|
0.008
|
0.046
|
|
2308
|
0.018
|
0.011
|
0.027
|
0.005
|
0.003
|
0.019
|
0.020
|
0.023
|
|
2400
|
0.020
|
0.002
|
0.034
|
0.005
|
0.002
|
0.024
|
0.041
|
0.027
|
|
2450
|
0.022
|
0.001
|
0.061
|
0.007
|
0.001
|
0.026
|
0.065
|
0.014
|