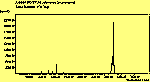
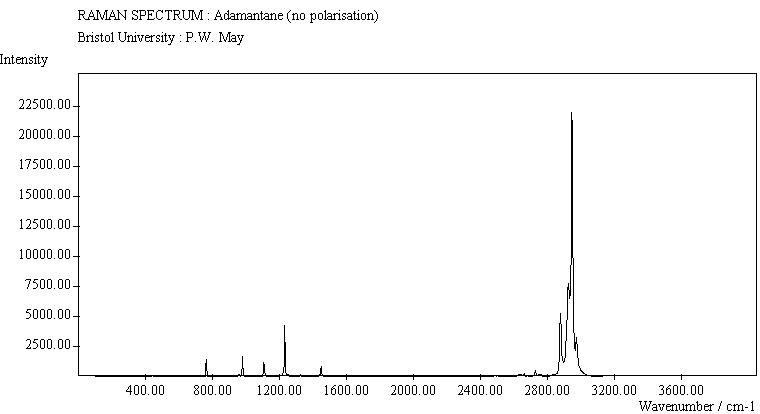
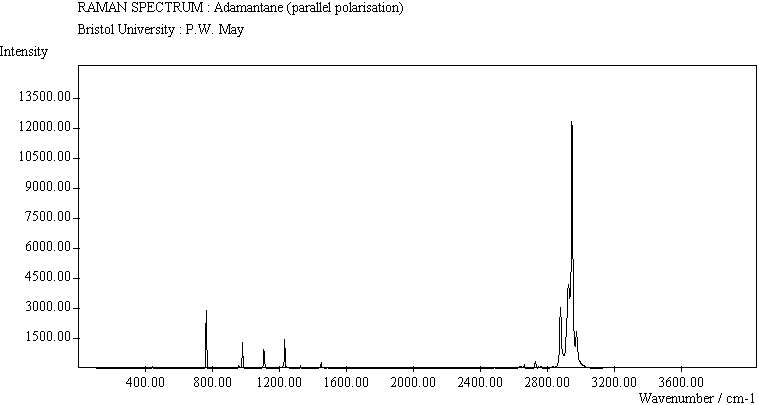
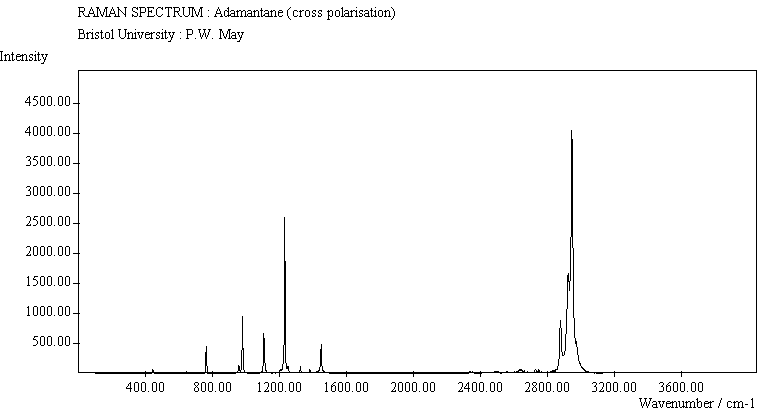
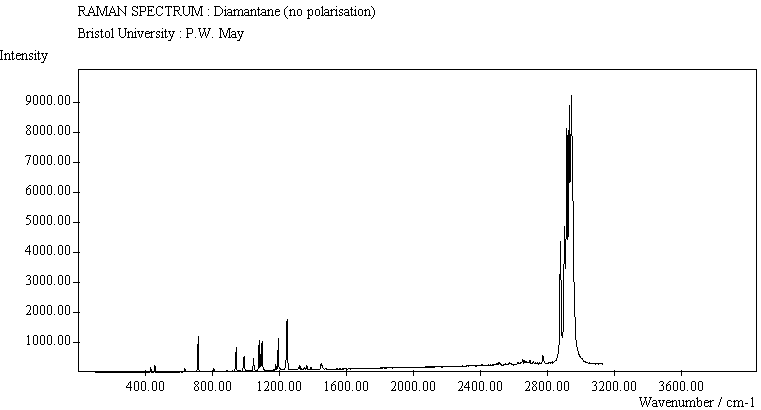
Full Range
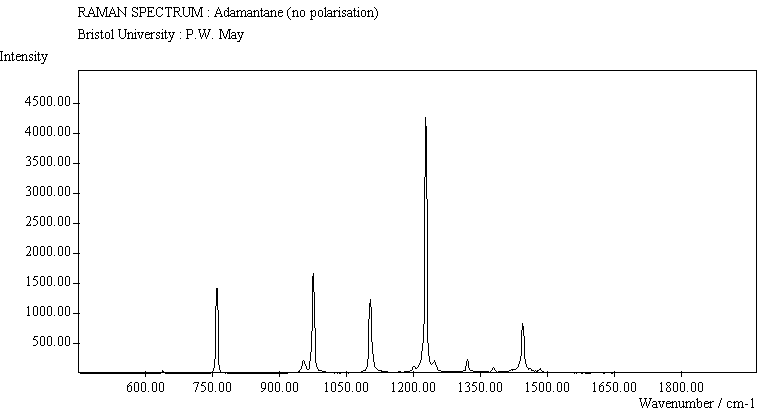
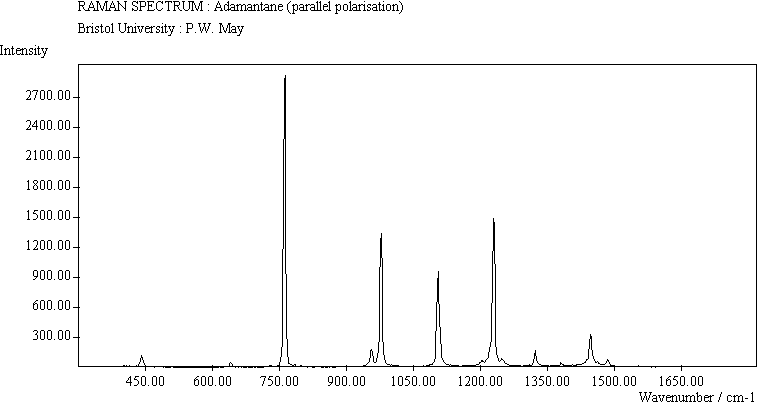
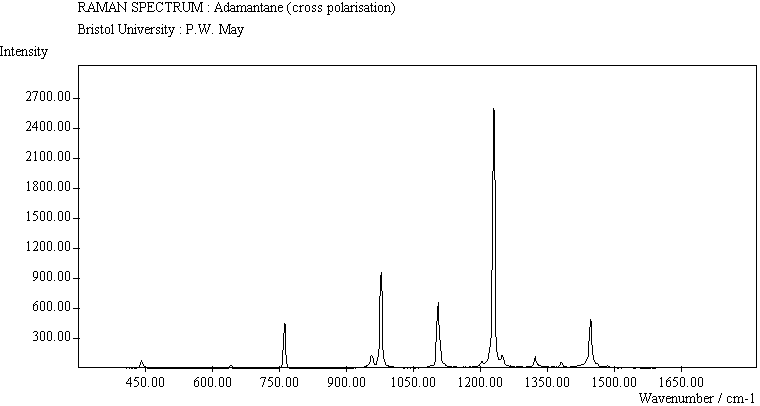
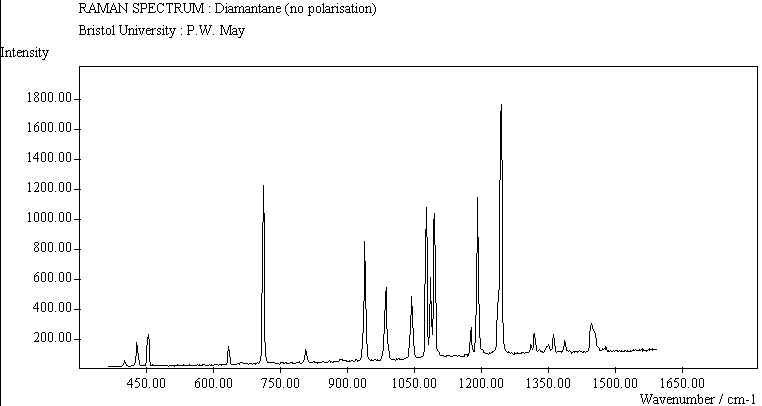
400-1500 cm-1
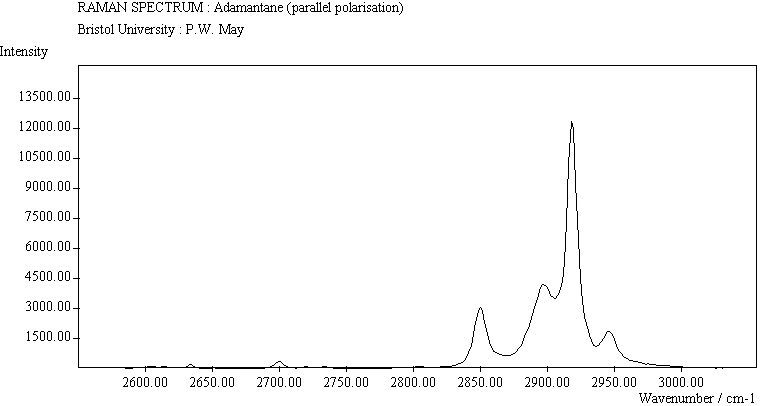
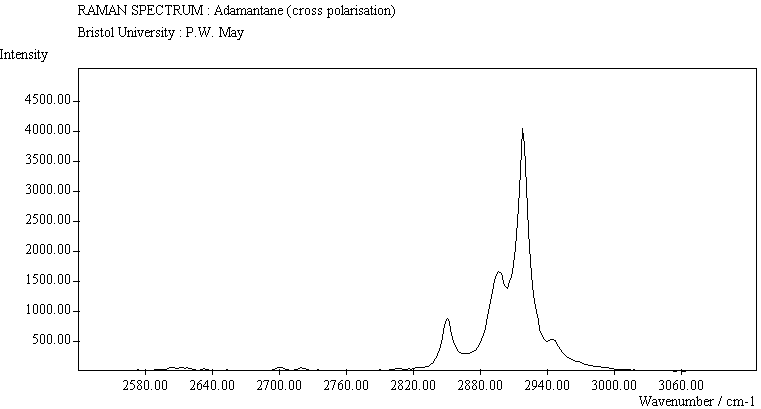
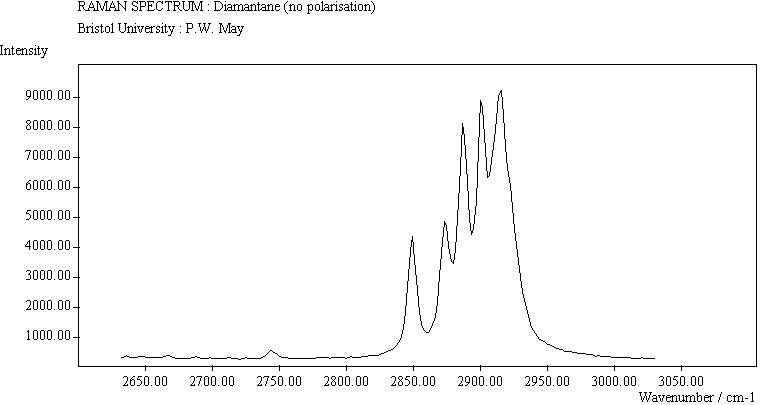
2600-3000 cm-1
(no pol.)

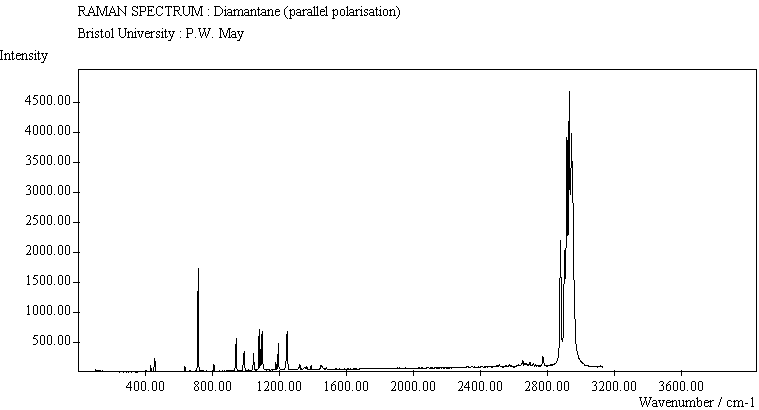
(para. pol.)
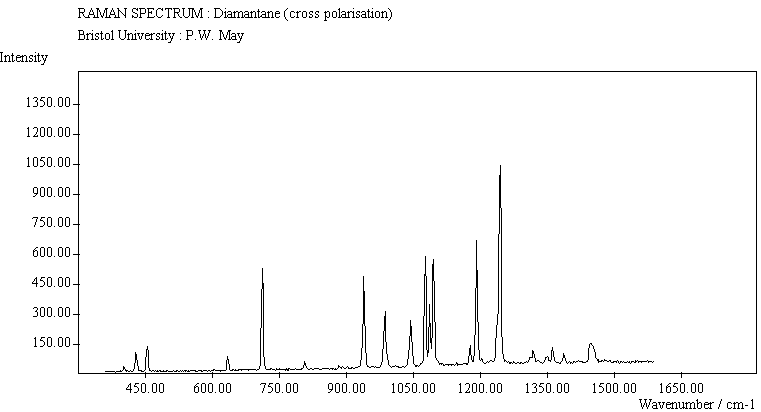
(cross pol.)
(no pol.)

(para. pol.)
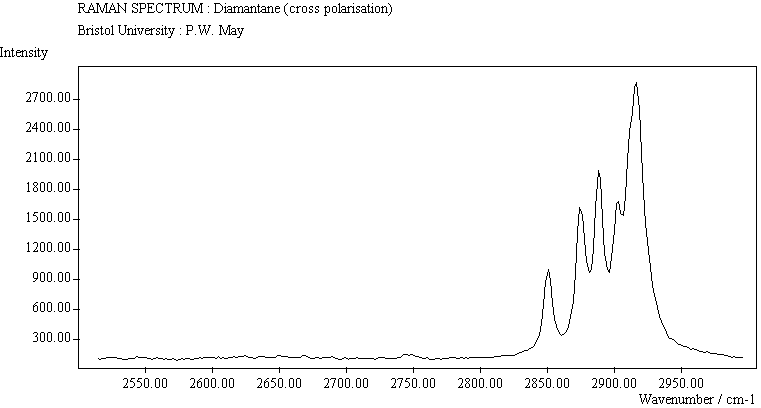
(cross pol.)
(no pol.)


(no pol.)
(para. pol.)
(cross pol.)
(no pol.)
(no pol.)

(no pol.)
Wavelength scale
(no pol.)
Wavelength scale
Laser Raman Spectroscopy (LRS) is an important technique used to analyse solid state materials [1]. Recently it has been extensively utilised to determine the quality of diamond films deposited by chemical vapour deposition (CVD) [2-6], since the ratio of the characteristic sharp diamond peak at 1332 cm-1 to that of the broad feature at ~1550 cm-1 corresponding to the graphitic G-band is an indication of the phase purity of the sample [2]. In some LRS studies of poorer quality diamond or of the initial stages of diamond growth, several peaks around 1130-1230 cm-1 have been observed [7], and have been tentatively assigned to 'nanophase' diamond, a term used to describe a material consisting of carbon having short range crystal order surrounded by a matrix of less ordered material. However these peak assignments are still controversial and more data are needed to clarify the situation. Apart from the diamond peak, the major peaks seen in this wavelength range are 1130 cm-1 [17], 1140 cm-1 [18] and 1149 cm-1 [7], all assigned to nanophase diamond, 1467 cm-1 [7] and 1480 cm-1 [17] assigned to a 'diamond precursor' or polyacetylene, and 1200-1210 cm-1, which has been seen in highly defective films grown by hot filament CVD [19], in highly B-doped diamond films [20], and at the substrate interface after hetereoepitaxial growth of diamond on Si [21], again being assigned to nanophase diamond. Confocal Raman studies of heteroepitaxial diamond film growth on Pt substrates [22] revealed peaks at 1230, 1640 and 1470-90 cm-1 assigned to defective disordered diamond nanocrystals, 1400 and 1530 cm-1 assigned to disordered graphite, and 1500 cm-1 assigned to a distorted sp3-bonded carbon network. Very recently, Prawer et al [8] obtained the LRS spectrum of so called 'amorphous diamond' (an amorphous but fully sp3-bonded carbon network) and found that it was dominated by a large peak at around 1200 cm-1.
The nanophase diamond that allegedly gives rise to some of these peaks can be considered to be a collection of fused adamantane units, since adamantane, C10H14, is the smallest building block exhibiting the diamond structure (see Fig.1). Higher diamondoids in the series exist [9], continuing with diamantane, C14H20, triamantane, C18H26xx, and so on. The first three in this series have been studied using LRS and the resulting peaks assigned to either C-C or C-H vibrational modes [10,13]. However these reports were performed before diamond CVD was established, and so spectra are not available in the literature which cover the wavelength region of interest to diamond CVD researchers. This is partly the motivation for the present work - to use modern LRS systems to obtain the spectra of relevant diamondoid structures over an appropriate wavelength range, and to compare these results with features observed in diamond films. We have chosen to use the first two in the series, adamantane and diamantane, since these are readily commercially available, as well as pentamantane, CxxHxx, which is a diamondoid that has only recently been extracted and isolated from petroleum [11].
| Adamantane | Diamantane | Diamond |
Adamantane and diamantane (also known as congressane) were purchased in crystalline form from BDH and Aldrich Chemicals, respectively. The pentamantane samples were two small crystals (0.5 mm on a side) obtained from XXXX of XXX University by extraction from petroleum oil [11]. The single crystal diamond sample was a type Ib high pressure high temperature (HPHT) synthetic diamond from Sumitomo Industries. This crystal was approximately 1 mm on a side and contained around 500 ppm of nitrogen. The CVD diamond films were deposited by standard hot filament CVD methods [12] using 1% CH4 in H2, and a Ta filament temperature of 2400K for 6 hours. The films were polycrystalline and about 3 µm thick, on a single crystal Si substrate. Sample J1 was an undoped film, whereas sample J2 was produced with 0.5% N2 being added to the process gas mixture to produce a slightly N-doped film.
Laser Raman spectroscopy was performed using a Renishaw Raman System 1000 operating at an excitation wavelength of 514.5 nm. The laser was polarised vertically, and 2 polarisation filters (one parallel and one perpendicular (crossed) to the laser polarisation) were used to give information about the symmetry of the vibrational modes in the samples.
The various spectra are shown in Table 1. The JCAMP file (.jdx) is an interactive file which can be viewed using a suitable reader, such as the Chime plug-in. It will allow you to zoom in and out of the spectra, and to save the data as x,y coordinates to your own computer. If you do not have the appropriate software to view these files, you can still see the important parts of the spectra as GIF images, which can also be printed if required.
| Sample |
JCAMP File |
Full Range |
Gif Images 400-1500 cm-1 |
2600-3000 cm-1 |
|---|---|---|---|---|
| Adamantane (no pol.) |
|
|
|
|
| Adamantane (para. pol.) |
|
|
|
|
| Adamantane (cross pol.) |
|
|
|
|
| Diamantane (no pol.) |
|
|
|
|
| Diamantane (para. pol.) |
|
|
|
|
| Diamantane (cross pol.) |
|
|
|
|
| Pentamantane (no pol.) |
|
|
|
|
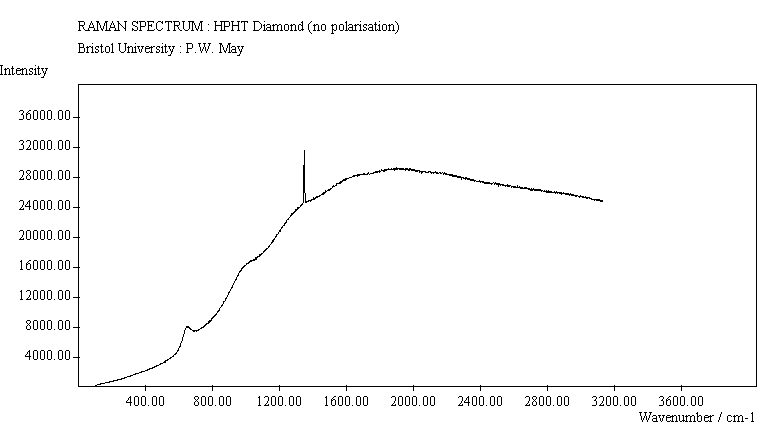
| HPHT Diamond (no pol.) |
|
|
||
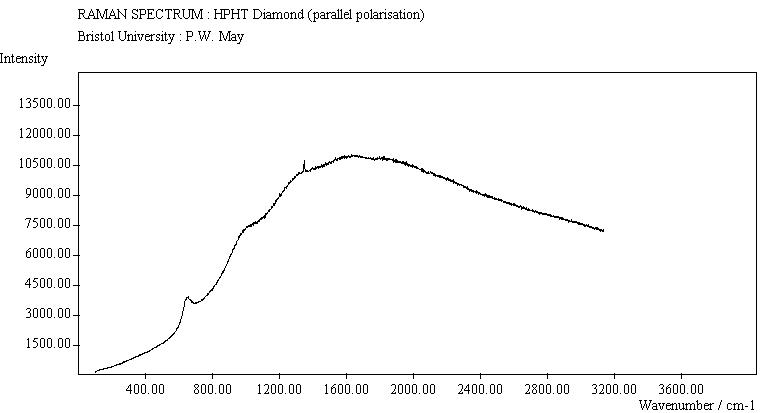
| HPHT Diamond (para. pol.) |
|
|
||
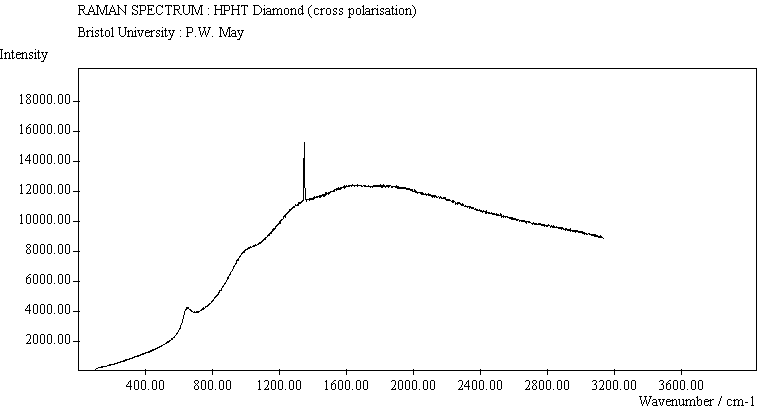
| HPHT Diamond (cross pol.) |
|
|
||
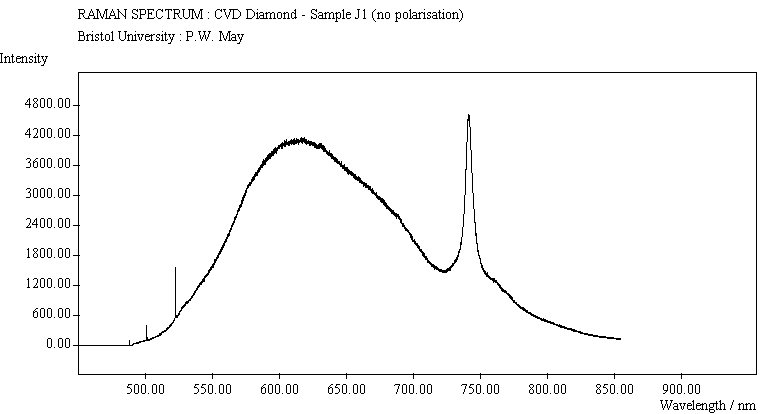
| CVD Diamond J1 (no pol.) |
|
|
||
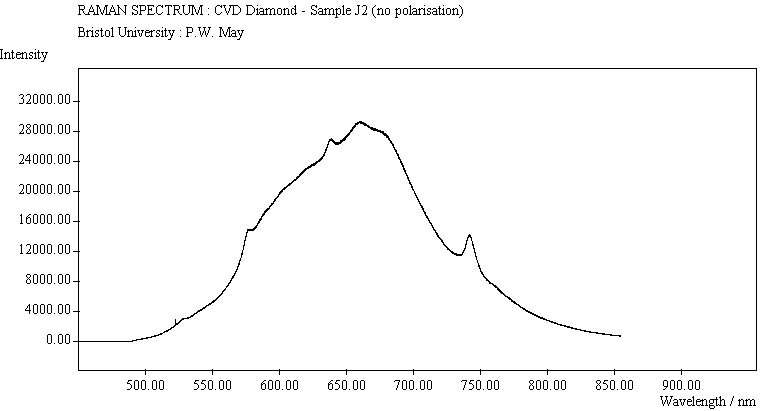
| CVD Diamond J2 (no pol.) |
|
|
||
| CVD Diamond J1 (no pol.) Wavelength scale |
|
|
||
| CVD Diamond J2 (no pol.) Wavelength scale |
|
|
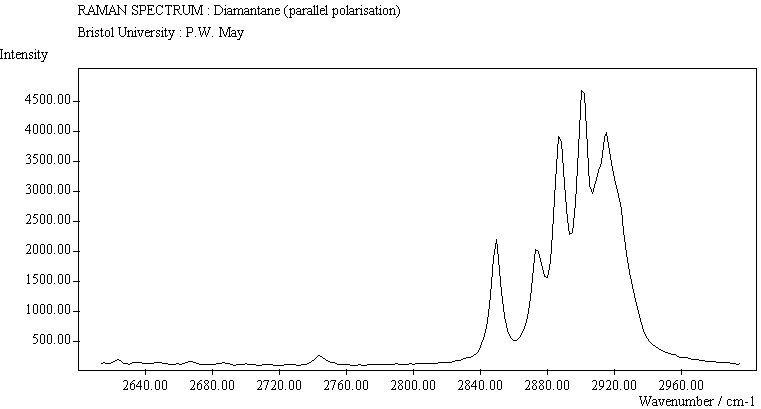
The spectra for the polymantanes show two regions, one at low energy (roughly 300-1600 cm-1) corresponding to the various C-C modes, and one at high energy (~2600-3000 cm-1) corresponding to the C-H modes. Discussion here about number of active modes we'd expect to see.....
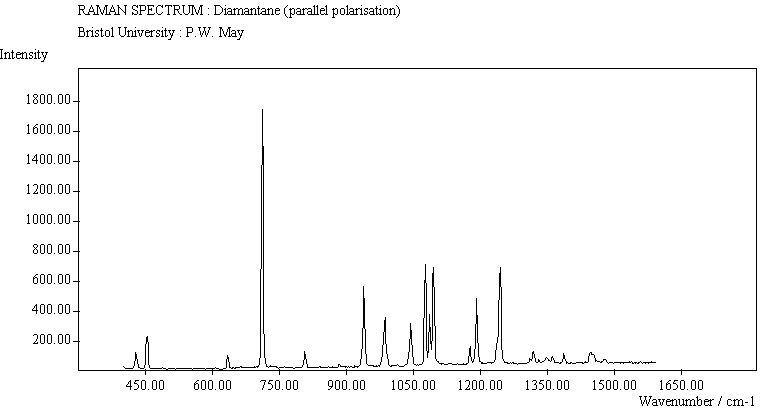
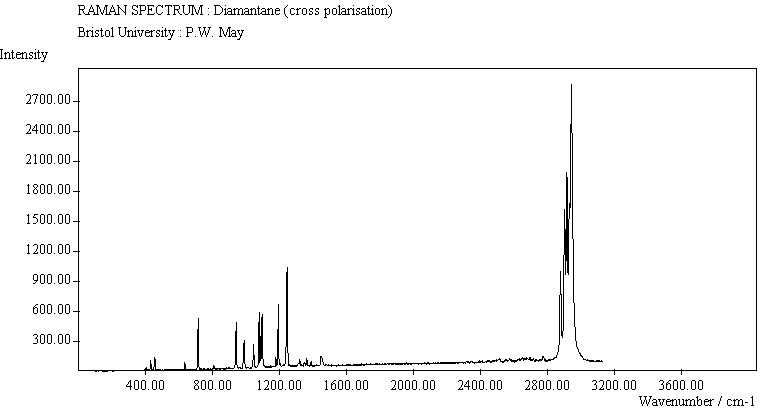
The peak assignments for adamantane and diamantane have been taken from ref[10] and are reproduced in Table 2. Our spectra agree with these very well, with the peaks appearing in virtually the same places as in this reference. By comparing the relative heights of the various peaks to their neighbours for different polarisations, we can see that for adamantane the peak at 760 cm-1 is polarised parallel to the laser, whereas the peak at 1218 cm-1 is cross polarised. All the C-H peaks between 2800-3000 cm-1 are parallel polarised. For diamantane we see that the peaks at 1181 and 1235 cm-1 are cross polarised and that at 709 cm-1 is parallel polarised. Again, we see that the C-H peaks between 2800-3000 cm-1 are all parallel polarised except for the peak at 2870 cm-1. This means...XXX
For pentamantane, tentative assignment of peaks has been suggested in ref[11] and are also reproduced in Table 2. As expected, we see many more peaks, but unfortunately no polarisation experiments were performed on these samples.
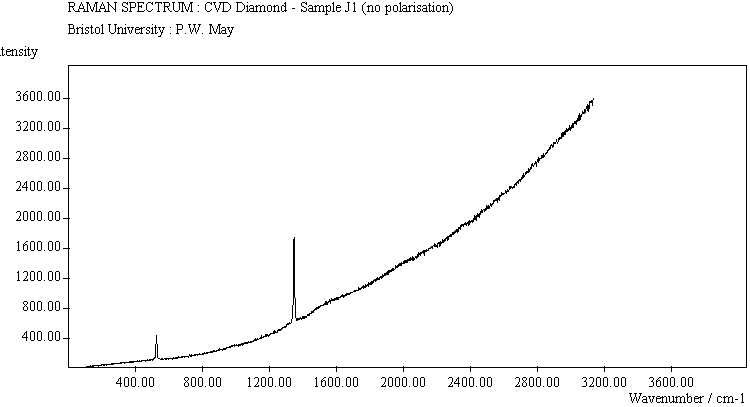
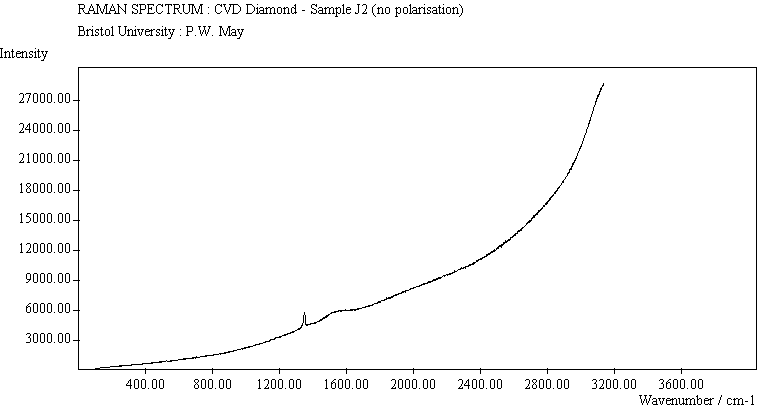
The diamond spectra show only one sharp feature at 1333 cm-1 characteristic of the diamond line, and a smaller broad feature at 630-650 cm-1 corresponding to the XXX. The diamond line is cross polarised. The diamond spectra also show the large photoluminescence (PL) background often seen in Raman spectroscopy of diamond.
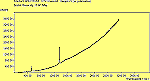
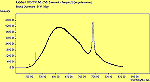
The CVD diamond spectra show both the diamond peak and a peak at 521 cm-1 due to the Si substrate, but these are superimposed on a much large photoluminescence background, indicating a greater degree of disorder within the sample CHECK.. This is especially true in the nitrogen-doped sample (J2) where the diamond peak is much smaller and the Si peak is no longer visible. The diamond peak in J2 has also shifted to slightly higher energy (1334 cm-1 in J1 and 1337 cm-1) and has broadened from a FWHM of 4 cm-1 in single crystal sample to 8 cm-1 in J1 and to 12 cm-1 in J2, indicating that either the film has become more stressed or that the phase purity has decreased. From the full range spectra plotted on a wavelength scale, we can see that as well as the broad PL hump centred at around 620 nm, there is a second large feature at 738 nm which has been identified as the GR1 vacancy site [14]. CHECK. In the undoped sample (J1) this peak is large and broad, whereas for the N-doped sample (J2) the peak has reduced in intensity relative to the PL background, and three more features at ~575, 636 and 658 cm-1 have appeared. The reduction in intensity of the GR1 peak can be explained since the addition of N will fill many of the vacancy sites responsible for this peak. The three other peaks have been assigned to N-V centres within diamond [15].
The polymantane spectra exhibit many peaks in the wavenumber region where nanophase diamond peaks have been reported, and as the size of the diamondoid structure increases the number and complexity of the spectral lines also increases. There is some correlation between the peaks assigned to nanophase diamond and those seen for the diamondoids, but the match is not convincing. For example there is a small pentmantane peak at 1141 cm-1 which is within the range 1130-50 cm-1 for which peaks were seen in nanophase diamond (although no large peaks in the wavelength range are seen for adamantane nor diamantane). Around 1200-50 cm-1, adamantane, diamantane and pentamantane all have peaks (at 1219, 1234 and 1221 cm-1, respectively), and again between 1430-80 cm-1 (1434, 1434 and 1444 cm-1, respectively). But if these are the lines assigned to nanophase diamond, we would expect to see many of the other, stronger, diamondoid lines as well (such as peaks around 1030-90 cm-1), rather than just one or two. This suggests that the spectral lines seen in diamond films are not due to the intrinsic vibrational modes of a diamondoid structure. This leads to the conclusion that some other aspect of the nanophase scale of the films is responsible for the observed features. One possibility is surface phonons and/or edge effects (CHECK) [16], which also have recently been found to have peak positions within the correct wavelength ranges [16].
PWM and TP wish to thank the Royal Society for funding. The authors also wish to thank Renishaw UK and the EPSRC for financial support and Prof. J.W. Steeds for the use of the Laser Raman equipment.