 |
|

|
| |
Potential Energy Surfaces for Triatomic Molecules |
|||||||
|
For a triatomic molecule such as ozone, there are more nuclear coordinates;
two inter-atomic distances, and the O—O—O bond angle. Often
the angle is fixed, leaving the two bond lengths as coordinates. Plotting
these against the potential energy produces a 3D topological map –
a clear visualisation of a potential energy surface.
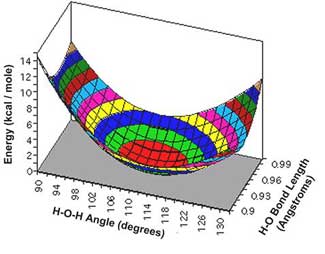
Again, the surface shows a sharp increase (to infinity) as the nuclei come close to each other. The minimum, or equilibrium geometry is where both O—O bond lengths are approximately 2.5au. Stretching the bonds simultaneously increases the potential energy, but stretching only one increases the potential energy only slightly; this is reflected in the channel or valley seen in the PES. A cross section parallel with one of the axes through this PES would be similar to the curve shown for a diatomic in Figure 4.1. An alternative way of plotting such a system on a 3D graph is, given a symmetric molecule such as ozone, the bond stretches can be calculated symmetrically (that is, simultaneously) and plotted on one axis; the bond angle being plotted on the other. Figure 5.2 shows a small section of the PES for water, with bond length and angle as independent coordinates:
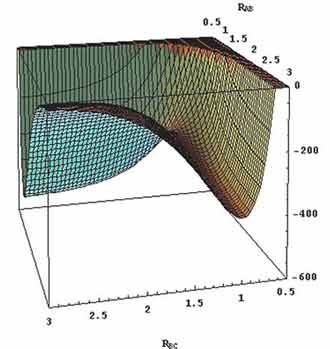
The three-dimensional PES is also used for triatomic systems involving
the substitution collision reaction of an atom with a diatomic molecule.
The most-studied of these is the so-called H3 system, H + H2
→ H2 + H. The PES for the H3 system is shown in Figure 5.3, below:
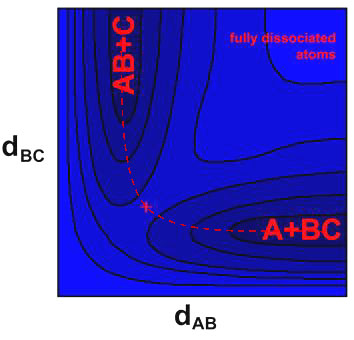
An alternative way of plotting 3D potential energy surfaces such as these is to use a contour plot. This is presented for a H3-like system in Figure 5.4; the A—B—C transition state barrier is marked by a red cross.
The minimum energy path is represented by the dashed line in Figure
5.4 – this involves the approach (decreasing inter-atomic distance,
dAB) of the reagents (A+BC), and
the subsequent separation of B and C (increasing inter-atomic distance,
dBC) following collision at the
transition state point (marked ‘+’). This motion, along one
of the axes, corresponds to asymmetric stretching. Symmetric stretching
is diagonal to this, and results in complete dissociation, but is energetically
prohibited by the steep walls of the minimum energy valley. 3D potential energy plots are also particularly suited to representation
using computer technology - below is a VRML object of the solvation potential
energy surface of 1-(4-methoxyphenyl)-cyclohexane-3,5-diol.
|
||||||||
| « Previous | Next » | ||||||||
|
[10] G. Barinovs, “Photodissociation Dynamics of Triatomic Molecules”, Ph.D. Thesis, Göteborg University, 2000 [11] M. Colvin, “Introduction to Computational Chemistry”, Sandia National Laboratory, Livermore: http://antas.agraria.uniss.it/Tutorials/CC/intro.html [12] S. Chapman, Department of Chemistry, Barnard College: http://bc.barnard.columbia.edu/~schapman/ [13] J.M. McBridge, “Potential Energy Surfaces for Structure and Dynamics”, Yale University, 2001: http://classes.yale.edu/chem125a/125/kinetics/PESEyring/potenergysurf.htm | ||||||||
|
Potential Energy Surfaces and Conical Intersections • June 2002 • Ian Grant |