Chapter
7
Photocurrent measurements: a
method to characterise surface states in CVD diamond
7.1. Introduction
Since the first paper using boron doped polycrystalline electrodes published by Pleskov 1 there has been an interest in the use of photoelectrochemical techniques to characterise the diamond electronic structure. Nakayaba et al. 2 describes the band edges of polycrystalline diamond using a pulse laser excitation. Yagi et al. 3 details the existence of surface states between the conduction and the valence band using similar techniques. Pleskov et al. 1, 4-7 relate further characteristics of the diamond-electrolyte interface using highly conductive boron doped diamond in aqueous solvent.
In this chapter electrochemical studies of highly conductive boron doped diamond in aqueous solvent are reported. The uv-vis spectra of different redox couples and their cyclic voltammograms will be described. These experiments give the background information for photocurrent experiments of boron doped polycrystalline diamond. Through this last technique the existence and energy of surface states will be determinated.
7.2. Experimental set-up
Electrochemical experiments were performed using a three electrode
system. This section descibes the apparatus used.
7.2.1. Electrolyte
solutions
18.3 MW cm ultrapure deionised water (Millipore) was used as solvent and 0.5
mol dm-3 potassium chloride (KCl) as supporting electrolyte.
Different solutions were prepared contaning:
·
1´10-3
mol dm-3 of 1,4-benzoquinone in 0.5 mol dm-3 KCl in H2O.
·
1´10-3
mol dm-3 of potassium ferricyanide (K3Fe(CN)6)
in 0.5 mol dm-3 KCl in H2O.
Glassware was cleaned using the five step procedure detailed in
section 5.3.1.
All the solutions were purged with standard laboratoy grade
oxygen-free nitrogen (N2) for aproximmately 30 minutes before any
electrochemical experiment was performed.
7.2.2. Growing characteristics of the
samples
The boron concentration
employed corresponded to a dopant density of 1021 cm-3,
i.e., the samples were degenerately doped. Diamond deposition was performed for
six hours, giving a film thickness of approximately 5 mm. The films were cooled in the chamber under
a hydrogen atmosphere. Electrical contacts were indium/gallium eutetic contacts
(see chapter 3 for further details).
The quality of the diamond films was assessed using Raman spectroscopy
and scanning electron microscopy, sem
(check chapter 2 for further details).
7.2.3. Surface sample preparation
Prior to the electrochemical studies the samples were prepared by immersing the diamond electrodes in a hot chromic acid solution (potassium dichromate saturated (K2Cr2O7) in hot sulfuric acid (H2SO4)).
7.2.3. Electrochemical Cells
The main type of cell used
in these studies was a single chamber design. A schematic diagram is shown in
figure 7.1. This cell design proved ideal for performing photoelectrochemical
experiments.
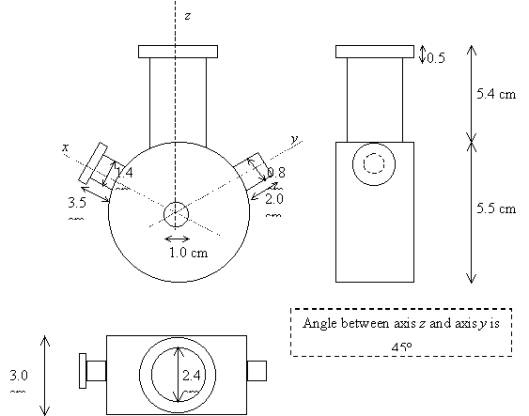
Figure 7.1. Detailed diagram of the glass cell used in these experiments.
The electrochemical cells
were fabricated from glass. A diamond sample mounted in a metal strip and
protected with PTFEª adhesive plastic to avoid
the corrosion of the electric contact or the metal strip, was located in the
central inlet of the glass cell as working electrode (WE). Lateral inlets were
designed to fit the counter (CE) and the reference electrodes (RE) respectively
(see figure 7.2).
The exposed area in the
photoelectrochemical experiments was defined by holes of 1 cm diameter in the
middle of the glass cell. Two different materials were used to cover the holes
in the faces of the glass cells, one was a silica plate (2.3 cm ´ 2.3 cm, 0.1 mm thick), and the other one was
a quartz plate (2.5 cm in diameter, 1mm thick). The range of the wavelengths
over which the materials were transparent differed, silica between 300 nm and
900 nm and the quartz one between 200 nm and 900 nm. These materials were
attached to the glass cell using silicon gel and checking that the cell was
sealed.
Figure 7.2. Schematic diagram of the electrochemical cell in experimental conditions.
7.2.4. Counter Electrodes
The counter electrodes have
been described in section 5.3.3.
7.2.5. Reference Electrodes
Silver | silver chloride (Ag
| AgCl) reference electrodes were used (BAS [Bioanalytical Systems, Inc.]
and CH Instruments, Inc.). These electrodes comprised of a silver chloride
coated silver wire in a glass tube with a porous polymer tip (Vycor frit). The glass tube formed an
electrode compartment which was filled with 3 mol dm-1 potassium
chloride (KCl) or sodium chloride (NaCl)ª. A diagram of a reference
electrode is shown in figure 7.3.
The standard potential, E0¢, for the Ag|AgCl redox couple
at 298 K is
+ 0.22 V relative to the normal hydrogen electrode (NHE) 9, 10. The redox potential for the reference electrode, E, is dependent on the concentration of
chloride ions in the electrode compartment. The Nernst equation for the Ag|AgCl
electrode can be represented as:
![]() where g = activity coefficient for the solution
where g = activity coefficient for the solution
[Cl-] = concentration of Cl- ions
This gave a redox potential
for the reference electrode of + 0.19 V vs.
NHE at 298 K.
Figure 7.3. A schematic diagram of a Ag | AgCl reference electrode
(adapted from BAS
sales literature)
7.2.6. Faraday Cages
Experiments were performed
in Faraday Cages. The cages were fabricated in-house by the mechanical
workshop. They were welded together from sheet steel and painted black. The
boxes measured approximately 1 m (height) ´ 1 m (width) ´ 1 m (depth). The front panel incorporated a
large hinged door.
The Faraday Cages isolated
the experiments from electromagnetic interference and external sources of
light.
7.2.7. Electronic equipment used in these studies
A light beam from a 75 W
xenon arc lamp source and monochromator (Photon Technology International, pti
SID-101) was first passed through a filter to remove any harmonics and subsequently
chopped. The frequency of chopping was approximately 17 Hz in order to approach
the time frame of the process involved in this system. The chopped light was
then focused, through the cover slide using silica lens (Laser 2000), onto the
working electrode. The wavelength employed was predominantly between 300 nm and
650 nm. The spectral resolution of the light was 2 nm and the area of
illumination was approximately 0.15 cm2. The electrode potential was
maintained at + 0.6 V or + 0.9V versus the reference electrode using an
in-house built potentiostat. This potentiostat was the instrument of choice in
all investigations requiring a modulated signal due to the high specification
of the current following amplifiers. The cell assembly was housed in a Faraday cage
to avoid any stray light or electrical pickup from external sources.
The chopper frequency was
controlled via a chopper unit (pti) and the reference pulse input to the
lock-in amplfier (Standford Research Systems SR 830 DPS). The current response
of the working electrode was subsequently routed from the potentiostat to the
lock-in amplifier to determine the modulated portion of the current. The
photocurrent response as a function of the incident wavelength light was
recorded, via the SID-101 interface (pti), onto a computer using software
modified in-house.
After each working electrode
spectrum was acquired, the spectrum of the xenon lamp was recorded under the
exact experimental conditions employed for the working electrode investigation.
In this instance the unchopped light beam was focused onto an in-house built,
calibrated photodiode assembly after first passing through the filter and the
response recorded directly to the computer via the SID-101 interface using the
in-house modified software.
Cyclic voltammogram
measurements were performed using EG&G Princeton Applied Research
Potentiostat/Galvanostat Model 273; controlled using Research Electrochemistry
software (version 4.3).
The Uv-vis spectra of the solutions were recorded using a Perkin-Elmer lambda bio-10.
7.3. Uv-vis spectra
Before any photocurrent
experiment was performed Uv-vis spectra from the electrochemical solutions were
recorded to investigate the absorption areas of the different redox couples
employed in these experiments.

Figure 7.4. Uv-vis
spectra of 1´10-3 mol dm-3
of 1,4-benzoquinone (pbq) in 0.5 mol dm-3 KCl /H2O
and 1´10-3 mol dm-3 of
potassium ferricyanide (K3Fe(CN)6) in 0.5 mol dm-3
KCl/H2O.
7.4. Cyclic voltammograms
A typical i-E curve for a boron doped
high conductive diamond electrode (oxygen terminated surface) immersed in the 1´10-3 mol dm-3 of
potassium ferricyanide (K3Fe(CN)6) in 0.5 mol dm-3
KCl aqueus solution is shown in the figure 7.5.
Figure 7.5. A cyclic voltammogram recorded at a boron
doped highly conductive diamond electrode (oxygen terminated surface) immersed
in 1´10-3 mol dm-3
K3Fe(CN)6
/0.5 mol dm-3 KCl in H2O.
The i-E curve was recorded at scan
rate of 0.1 V s-1.
The curve shows a reversible reduction peak at 0.10 V and a reversible oxidation peak at 0.35 V that correspond with the formation of the species Fe(CN)64-/ Fe(CN)63- respectively. The behaviour observed is typical for the reduction of K3Fe(CN)4 in aqueous solvent 11-13. The magnitude in the differences between peaks (0.25 V) can be explained by the fact that the cyclic voltammogram was recorded in the absence of iR compensation.
A typical i-E curve for a boron
doped high conductive diamond electrode (oxygen terminated surface) immersed in
the 1´10-3 mol dm-3 of
1,4-benzoquinone (Q) in 0.5 mol dm-3 KCl aqueus solution is shown in
the figure 7.6.
Figure 7.6. A cyclic voltammogram recorded at a boron
doped highly conductive diamond electrode (oxygen terminated surface) immersed
in 1´10-3 mol dm-3
1,4-benzoquinone/0.5 mol dm-3 KCl in
H2O. The i-E curve was
recorded at scan rate of 0.1 V s-1.
The curve shows a reversible reduction peak at -0.4 V and a reversible oxidation peak at 0.9 V that correspond with the formation of the species Q/Q2- respectively. The behaviour observed is the typical for the reduction of 1,4-benzoquinone in aqueous solvents 14,15. The magnitude in the differences between the peak (1.5 V) can be explained by the fact that the cyclic voltammogram was recorded in absence of iR compensation and the kinetics for the redox couple appears to be slow.
7.5. Photocurrent experiments
Photocurrent spectra for potassium ferricyanide and 1,4-benzoquinone solutions were investigated. The wavelength range used was between 650 nm and 300 nm.
In the case of ferricyanide, at the concentration chosen for these studies the absorption of the solution in the visible region (see figure 7.4) restricts the photocurrent response from the diamond electrode, hence only the results pertaining to 1,4-benzoquinone will be discussed in detail.
The photocurrent spectrum for 1,4-benzoquinone, was performed at two different potentials: +0.6 V and +0.9 V (see figure 7.7). The reason for the choice of these two particular potentials was to check the photocurrent behaviour of the boron doped high conductive diamond electrode at the beginning and maximum of the oxidation area defined by the peak in the cyclic voltammogram (see figure 7.6). In the photocurrent spectra at both potentials corrections were included to eliminate the possible distortions from the silicon substrate, possible harmonics of the beam light and the Xe lamp spectrum.
Negligible differences between the two potentials can be observed in the continuous spectra shown in the figure 7.7. If the ramp of the plot between 380nm and 400 nm is considered as a straight line and extrapolated to intercept the x axis, a value for energy level of the transition that generates the photocurrent can be calculated. In this case a value of 420 nm is obtained.

Figure 7.7. Photocurrent spectra recorded at a boron
doped highly conductive diamond electrode (oxygen terminated surface) immersed
in 1´10-3 mol dm-3
1,4-benzoquinone/0.5 mol dm-3 KCl in
H2O. The curves were recorded at +0.6 V and +0.9 V vs AgCl
reference.
Considering the following equation:
![]()
[equation 7.1]
Where E is the energy of the state in Joules, h is the Planck constant (6.63´10-34 J s), c is the speed of light in vacuum (3.00´108 m s-1) and l is the intercept value of the photocurrent plot in meters. Substituting all the parameters in the above equation an energy state of 7.31´10-19 J is obtained. Frequently in the literature all the energy states values in the semiconductor technology are referred to in eV. A simple calculation can be done to obtain that value. Knowing that 1 eV is 1.60´10-19 J, a value of 3.03 eV is calculated. This value of energy is situated approximately in the middle of the band gap. The photocurrent process suggest that the light is due to electron excitation for the valence band to a surface state. 2, 3, 6, 16-21.
In studies of oxygenated p-typed diamond electrochemistry involving aqueous electrolytes evidence for surface state mediated charge transfer has been observed 22, 23. For non aqueous solvents it has been suggested that the presence of surface states (see chapter 5 for further details) in the oxygen terminated diamond structure. In both situations it is postulated that the surface states are related to the graphite contamination during the growing of the boron doped diamond samples. If the value obtained by the photocurrent spectra, 3.03 eV, is compared with the values described in figure 5.11 it appears that the photoactive state is not due to graphite impurities. This surface state seems to be related with the boron inclusions in the crystalline structure during the growth process. Nebel et al.21 describe stable energy states for elemental boron in CVD diamond between 3.0 to 3.5 eV. Nakabayashi et al. 2 describe using a pulse laser excitation three surfaces states at 2.54 eV (490 nm), 2.89 eV (430 nm) and 3.45 eV (360 nm). Gheeraert et al. 24 measured thermoluminescence from polycrystalline diamond films and reported the presence of a surface state 2.5 eV bellow from the conduction band (5.5 eV). This locates the state at 3.0 eV very close to the value obtained in this study. From these data a new diagram can be proposed to complete the one presented in figure 5.11.
Figure 7.8. Proposed energy diagram for diamond
–electrolyte interface for hydrogen and oxygen terminated.
Further experiments will be required in an effort to characterise in high detail this suggested boron related surface state applying similar methods used in the chapter 5.
To explain the mechanism of the photocurrent process it is easier to consider the system before the incident light beam first irradiates the diamond surface. At this moment, electron transfer between the redox couple and the valence band mediated for the surface states are equivalent in forward and backward directions. When the incident photons with enough energy (greater than the energy of the surface state, 3.03 eV and smaller than the band gap (5.45 eV)) are absorbed electrons are promoted to the surface state. Some of them tunnel through the surface state, and into the solution to increase the rate in the reduction of the redox couple. At this moment a photocurrent is observed because the positive charge (holes) are moving back through the circuit. In other words, current is detected for the excitation of the surface. After a while the rate in the electron transfer becomes equivalent for the forward and backward reaction because the backward reaction in the electron transfer increase its rate. Thus the photocurrent decays back to zero.
7.6. Conclusions
Photostudies of highly conductive boron doped diamond in aqueous solvent suggest the presence of surface states. The energy of the states suggests they are not due to graphitic surfaces states as frequently reported. An alternative explanation for the origin of the surface state is boron impurities.
7.7. References
1 Y. V. Pleskov, A. Y. Sakharova, M. D. Krotova, L. L. Bouilov, and B. P. Spitsyn, J. Electroanal. Chem., 1987, 228, 19.
2 S. Nakabayashi, N. Ohta, and A. Fujishima, PCCP, 1999, 1, 3993.
3 I. Yagi, K. Tsunozaki, D. A. Tryk, and A. Fujishima, Electrochem. Solid State Lett., 1999, 2, 457.
4 Y. V. Pleskov, V. M. Mazin, Y. E. Evstefeeva, V. P. Varnin, I. G. Teremetskaya, and V. A. Laptev, Electrochem. Solid State Lett., 2000, 3, 141.
5 Y. V. Pleskov, V. P. Varnin, I. G. Teremetskaya, and A. V. Churikov, J. Electrochem. Soc., 1997, 144, 175.
6 A. Y. Sakharova, Y. V. Pleskov, F. Diquarto, S. Piazza, C. Sunseri, I. G. Teremetskaya, and V. P. Varnin, J. Electrochem. Soc., 1995, 142, 2704.
7 Y. V. Pleskov, A. Y. Sakharova, E. V. Kasatkin, and V. A. Shepelin, J. Electroanal. Chem., 1993, 344, 401.
8 A. W. Bott, Curr. Sep., 1995, 14, 64.
9 B. E. Conway, 'Electrochemical Data', ed. E. P. Company, 1952.
10 H. S. Harned and R. W. Ehlers, J.Am.Chem.Soc., 1932, 54, 1350.
11 S. Jolley, M. Koppang, T. Jackson, and G. M. Swain, Anal. Chem., 1997, 69, 4099.
12 M. C. Granger and G. M. Swain, J. Electrochem. Soc., 1999, 146, 4551.
13 J. K. Zak, J. E. Butler, and G. M. Swain, Anal. Chem., 2001, 73, 908.
14 R. Ramesham and M. F. Rose, J. Mater. Sci. Lett., 1997, 16, 799.
15 F. Marken, C. P. Paddon, and D. Asogan, Electrochem. Commun., 2002, 4, 62.
16 E. Rohrer, C. E. Nebel, M. Stutzmann, A. Floter, R. Zachai, X. Jiang, and C. P. Klages, Diam. Relat. Mater., 1998, 7, 879.
17 M. C. Rossi, S. Salvatori, F. Scotti, G. Conte, and E. Cappelli, Physica Status Solidi a-Applied Research, 2000, 181, 29.
18 C. E. Nebel, M. Stutzmann, F. Lacher, P. Koidl, and R. Zachai, Diam. Relat. Mater., 1998, 7, 556.
19 C. E. Nebel, A. Waltenspiel, M. Stutzmann, M. Paul, and L. Schafer, Diam. Relat. Mater., 2000, 9, 404.
20 C. E. Nebel, R. Zeisel, and M. Stutzmann, Diam. Relat. Mater., 2001, 10, 639.
21 C. E. Nebel, E. Rohrer, and M. Stutzmann, J. Appl. Phys., 2001, 89, 2237.
22 M. C. Granger, M. Witek, J. S. Xu, J. Wang, M. Hupert, A. Hanks, M. D. Koppang, J. E. Butler, G. Lucazeau, M. Mermoux, J. W. Strojek, and G. M. Swain, Anal. Chem., 2000, 72, 3793.
23 S. Alehashem, F. Chambers, J. W. Strojek, G. M. Swain, and R. Ramesham, Anal. Chem., 1995, 67, 2812.
24 M. Benabdesselam, P. Iacconi, D. Briand, T. Lapraz, E. Gheeraert, and A. Deneuville, Diam. Relat. Mater., 2000, 9, 56.