e) Displaying molecular orbitals
Generating 3D representations of molecular orbitals (MOs) is much trickier than simply obtaining the atomic coordinates, but nevertheless, there are a few commercial (and therefore expensive) programs which can do this. Desktop computer packages, such as ChemDraw 3d and HyperChem can both calculate the MOs corresponding to different energies for simple molecules using semi-empirical (such as Extended Hückel theory) methods. More sophisticated mainframe programs, such as Gaussian, MolPro and GAMESS can also do so. The iso-surfaces of these orbitals can then be displayed and manipulated in 3D in the window. However, the MO data from these programs cannot be saved out into a format that can be read by any of the existing web browser plug-ins, which means that displaying interactive MOs on a web page is still not straightforward. However, static gif or jpg images can be captured from the screen, as shown in Fig.15.
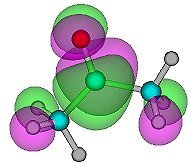 |
Fig.15. The lowest unoccupied MO (LUMO) of acetone, calculated using the HyperChem program. This MO was created very simply in the program - only 4 mouse clicks were required, and no knowledge of the theory behind the calculation was needed! Within the program window, the structure and MOs can be rotated in 3D, different iso-surfaces can be chosen, and the degree of transparency can also be changed, but unfortunately these data cannot be saved into formats readable by other viewing programs. As well as orbitals, HyperChem can also calculate and plot iso-surfaces for total spin density, total charge density and the electrostatic potential around the atoms. |
Apple QuickDraw 3d viewer is available both as a stand-alone package and as a browser plug-in, and will display interactive structures of molecules with orbitals. However, it will not load standard 3D coordinate files (such as pdb or mol), and accepts only the QuickDraw 3D Metafile format (3dmf). But, if you have a suitable computer package that can calculate orbitals, such as Gaussian, GAMESS or CACHE, and have the facility to save these data as 3dmf files, then it a compact method of storing and representing 3D orbital data on the web.
 |
Fig.16. A screen shot from the QuickDraw 3d viewer showing one set of orbitals for ethene. If you have the QuickDraw 3d plug-in or helper program, click on the image to activate the 3d file. |
Perhaps the best and easiest method of generating 3D orbitals is available as an online java applet located at the University of Erlangen in Germany, as part of their chemical VRML services [10]. The applet is called OrbVis, and produces VRML output which can be displayed and manipulated on-line in a suitable VRML plug-in. The reader must first draw the molecule using a java chemical drawing applet (see Fig.17). The MOs are then calculated, and the reader selects one of the available MOs, which is then displayed in the window of a VRML plug-in, such as Cosmoplayer or Cortona (see Fig.18). Again, the molecule and orbitals can be manipulated in real-time in the window, but unfortunately, the data cannot be saved for subsequent analysis or re-displaying off-line.
 |
 |
| Fig.17. Screenshot of the molecule editor applet window from the VRML services page at the University of Erlangen [10], which was originally developed by Peter Ertl at Novartis [11]. | Fig.18. Screenshot of an orbital for the nitrobenzene molecule, calculated by the OrbVis applet and then displayed in a VRML viewer. |
Next Page - Interactive Spectra - JCAMP files