
 Laser Raman Spectroscopy and Modelling of Diamondoids
We used our Renishaw Raman spectrometer to take Raman spectra of a number of diamondoid crystals, supplied to us by Molecular Diamond Technologies (a part of Chevron USA). We also performed ab initio DFT calculations to simulate these spectra, in order to assign the peaks to specific vibrational modes.
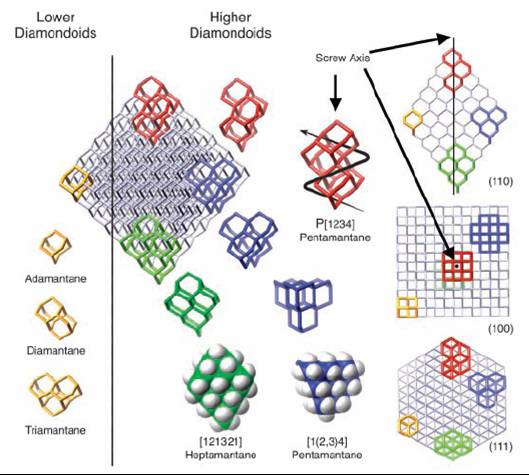
Diamondoids are hydrocarbon molecules that are totally or largely superimposable on the diamond lattice. The first in the series is adamantane, and higher diamondoids are made by fusing together successive adamantane units. A large number of such units makes diamond.
 Diamondoids occur naturally in virtually all petroleum (1-10 ppm). Molecular Diamond Technologies extracted them by reverse-phase HPLC, and then recrystallised them by standard organic chemistry techniques. Samples were available for many of the smaller diamondoids, either as powders or as small crystals around 1 mm3 in size (see photo, right).
The Raman spectra of the diamondoids contain 2 regions of interest, a low-energy region (400-1500 cm-1) due to stretching of the C-C cage, and a high-energy region (2700-3100 cm-1) due to C-H stretches and bends. An example of one of the vibrations from each of these 2 regions can be seen below in the spectrum of 1212 pentamantane.
The Raman spectrum of 1212 pentamantane (above),
and an example of a C-C cage vibrational mode (below left) and a C-H stretching mode (below right)

Raman Spectra
The spectra and structures for all of the diamondoids we have studied are below. The Raman spectra were taken from powder samples or single crystals using a 488 nm laser. The 3D structures of the molecules can be downloaded as mol files by clicking on the molecular image. The Raman data can also be downloaded as an Excel file (x,y plot), or JCAMP format.
| Name / Structure | Raman Spectrum | Data (Excel format) | Data (JCamp format) |
|---|---|---|---|
Adamantane |
 |
ada.xls | ada.jdx |
Diamantane |
 |
dia.xls | dia.jdx |
Triamantane |
 |
tria.xls | tria.jdx |
[1(2)3] tetramantane![[1(2)3] tetramantane](diamondoids/structures/1(2)3.gif) |
![Raman spectrum of [1(2)3] tetramantane](diamondoids/spectra/1(2)3-tetramantane.gif) |
1(2)3.xls | 1(2)3.jdx |
[121] tetramantane![[121] tetramantane](diamondoids/structures/121.gif) |
![Raman spectrum of [121] tetramantane](diamondoids/spectra/121-tetramantane.gif) |
121.xls | 121.jdx |
[123] tetramantane![[123] tetramantane](diamondoids/structures/123.gif) |
![Raman spectrum of [123] tetramantane](diamondoids/spectra/123-tetramantane.gif) |
123.xls | 123.jdx |
[1(2,3)4] pentamantane![[1(2,3)4] pentamantane](diamondoids/structures/1(23)4.gif) |
![Raman spectrum of [1(2,3)4] pentamantane](diamondoids/spectra/1(23)4-pentamantane.gif) |
1(23)4.xls | 1(23)4.jdx |
[12(1)3] pentamantane![[12(1)3] pentamantane](diamondoids/structures/12(1)3.gif) |
![Raman spectrum of [12(1)3] pentamantane](diamondoids/spectra/12(1)3-pentamantane.gif) |
12(1)3.xls | 12(1)3.jdx |
[12(3)4] pentamantane![[12(3)4] pentamantane](diamondoids/structures/12(3)4.gif) |
![Raman spectrum of [12(3)4] pentamantane](diamondoids/spectra/12(3)4-pentamantane.gif) |
12(3)4.xls | 12(3)4.jdx |
[1212] pentamantane![[1212] pentamantane](diamondoids/structures/1212.gif) |
![Raman spectrum of [1212] pentamantane](diamondoids/spectra/1212-pentamantane.gif) |
1212.xls | 1212.jdx |
[1213] pentamantane![[1213] pentamantane](diamondoids/structures/1213.gif) |
![Raman spectrum of [1213] pentamantane](diamondoids/spectra/1213-pentamantane.gif) |
1213.xls | 1213.jdx |
[1234] pentamantane![[1234] pentmantane](diamondoids/structures/1234.gif) |
![Raman spectrum of [1234] pentamantane](diamondoids/spectra/1234-pentamantane.gif) |
1234.xls | 1234.jdx |
3-methyl-[1(2,3)4] pentamantane![3-methyl-[1(2,3)4] pentamantane](diamondoids/structures/methylp.gif) |
![Raman spectrum of 3-methyl-[1(2,3)4] pentamantane](diamondoids/spectra/methylpentamantane.gif) |
methylpent.xls | methylpent.jdx |
[12312] hexamantane![[12312] hexamantane](diamondoids/structures/12312.gif) |
![Raman spectrum of [12312] hexamantane](diamondoids/spectra/12312-hexamantane.gif) |
12312.xls | 12312.jdx |
[121321] heptamantane![[121321] heptamantane](diamondoids/structures/121321.gif) |
![Raman spectrum of [121321] heptamantane](diamondoids/spectra/121321-heptamantane.gif) |
121321.xls | 121321.jdx |
Related Papers
- J. Filik, J.N. Harvey, N.L. Allan, P.W. May, J.E.P. Dahl, S. Liu, and R.M.K. Carlson, "Raman Spectroscopy of Diamondoids", Spectrochimica Acta A: Mol. Biomol. Spect. 64 (2006) 681-692.
- J. Filik, J.N. Harvey, N.L. Allan, P.W. May, J.E.P. Dahl, S. Liu, R.M.K. Carlson, "Raman spectroscopy of nanocrystalline diamond: An ab initio approach", Phys. Rev. B. 74 (2006) 035423 1-10.
- N.C. Polfer, O. Pirali, Y. Ueno, R. Maboudian, P.W. May, J. Filik, J.E. Dahl, S. Liu, R.M.K. Carlson, "Infrared spectroscopic investigation of higher diamondoids", J. Mol. Spectr. 238 (2006) 158-167.
- J.N. Hart, P.W. May, N.L. Allan, J.E Dahl, Shenggao Lui, Robert M Carlson, J.L. Adcock, "Vibrational analysis of per-fluorinated-triamantane", Chem. Phys. Letts.. 460 (2008) 237-240.