Measurement and Quantification of El Niño
The atmospheric pressure at Darwin and Tahiti show an inverse relationship to each other, and the ratio of the two measurements provides a good measurement of ENSO: it is termed the Southern Oscillation Index (SOI). It ranges from about +30 to about -30. Forecasters are today able to predict the onset of El Niño and La Niña events in advance, with organisations. Greatly high Darwin pressure compared to Tahiti (a positive ratio above 5) indicates El Niño conditions; strongly negative (<-5) indicates La Niña.
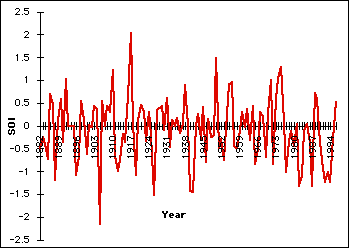
This shows SOI data since records began. These are plotted below by taking the mean of each year (which explains why the values do not reach those described above - those only occur
in peak season around Christmas).

Various facts may be noticed:
- Events tend to alternate about every 2 years but sometimes gaps can be 1 or up to 10 years
- Strengths vary greatly
- There have been eight majoor events since the late 1950s:
- 1957-58
- 1965
- 1968-69
- 1972-73
- 1976-77
- 1982-83 - the strongest ever recorded
- 1986-87
- 1990-1995 - the longest yet
- The graph is not always at the extremes of El Niño and La Niña; there are calm periods between.
Previous: changes to the Pacific current system due to El Niño
Next: effects of El Niño


![]()