xyz file formats are probably the simplest of the 3D structure files, since they contain little more than the x, y and z coordinates of each atom in the molecule. Other information, such as bond order or charge is not specified. Despite their simplicity, xyz files are very useful since many xyz files can be joined together into one long file, which when interpreted by an appropriate graphics package, such as Chime, appear as animation in the browser. Because the graphics package decides if there is a bond between atoms based only on their proximity, atoms which move closer together and then further apart will appear to form a bond and then break it again.
An example of a very simple xyz file for the CO2 molecule is given below:
3
 0
 C 0.000000    0.000000    0.000000
 O 0.000000    0.000000    1.159076
 O 0.000000    0.000000   -1.159076
The number 3 in the first column shows the number of atoms in the molecule. The number in the next row, second column is the frame number of any animation, beginning with 0. Then come the atomic symbols and x,y,z coordinates for each atom in the subsequent rows.
To make an animation, simply repeat this format for every new frame beneath this one, with the new values of x, y and z. These new coordinates can either be calculated directly, or estimated (if accuracy is not important). One method to use is to work out the starting and final coordinates of each atom undergoing motion, and then linearly interpolate between these in suitable step sizes. For example, here are the first 6 frames from the xyz file which simulates one of the oxygens on CO2 spontaneously dissociating and moving away from the molecule.
3
 0
 C 0.000000    0.000000    0.000000
 O 0.000000    0.000000    1.159076
 O 0.000000    0.000000   -1.159076
3
 1
 C 0.000000    0.000000    0.000000
 O 0.000000    0.000000    1.200000
 O 0.000000    0.000000   -1.159076
3
 2
 C 0.000000    0.000000    0.000000
 O 0.000000    0.000000    1.300000
 O 0.000000    0.000000   -1.159076
3
 3
 C 0.000000    0.000000    0.000000
 O 0.000000    0.000000    1.400000
 O 0.000000    0.000000   -1.159076
3
 4
 C 0.000000    0.000000    0.000000
 O 0.000000    0.000000    1.500000
 O 0.000000    0.000000   -1.159076
3
 5
 C 0.000000    0.000000    0.000000
 O 0.000000    0.000000    1.600000
 O 0.000000    0.000000   -1.159076
...etc.
The image shown in Fig.13 (right) is what this would look like rendered in Chime. When the C-O bond length becomes too large, Chime automatically 'breaks' the bond. The extra Chime commands needed to control the animation are: 'animfps=15 startanim=true animmode=loop', where 'animfps' is the animation speed in frames per second, 'startanim=true' tells the animation to start immediately upon loading, and 'animmode=loop' forces the animation to cycle repeatedly.
To simulate the simple harmonic motion of a vibration, a sinusoidal interpolation between the maximumand minimum atom positions can be used. An example is shown in Fig.13 (left) for the symmetric stretch of CO2. The xyz file for this can be seen in Appendix 2. Note that in real vibrations the atoms move typically only a few percent of the bond length, which can be difficult to see in an image. Therefore, for the purposes of visualisation, the atomic motion has been exaggerated.
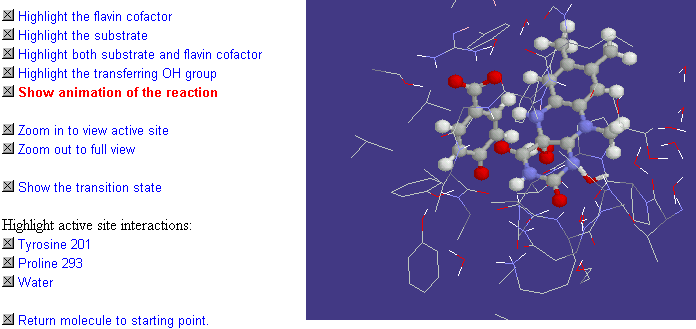
Fig.14 shows an example of how animated xyz files can be used to display the movement of atoms in a real chemical reaction. In this case it's the hydroxylation reaction of the enzyme p-hydroxybenzoate-3-hydroxylase (PHBH). This has been calculated using a QM/MM approach, which uses quantum mechanical (AM1) treatment of the small group of reacting atoms but molecular mechanical treatment of other atoms [7-9]. The calculation yields the x,y,z coordinates for the atoms undergoing the reaction, taken in small time steps along the reaction coordinate. These sets of coordinates are then combined together into a single xyz file which is then animated in Chime. It can be seen as the animation runs that the hydroxyl group is transferred from the flavin cofactor to the substrate, and that nearby tyrosine, proline and water groups interact with the reacting atoms and so also play a role in the mechanism. In particular, you can see that the proline moves close to the transferring OH, and so appears to specifically stabilise the transition state.

Fig.14. A screenshot of the animation of the PHBH hydroxylation reaction. If you have the Chime plug-in, the complete interactive simulation can be seen by clicking on the image.
3D structure animations are also available in VRML from the University of Erlangen on-line web page [10].